
Key summary:
This Allocution concerns the senior and advanced patterns of Candlesticks, where three or more sticks are grouped together to form a pattern. In order to do this, a larger number of sticks need to be considered in order to form a comprehensive view of past and future trends. However, the names aren’t as important here, because after all, investors aren’t concerned by attractive and romanticized terms, but simply need to understand the essence of what’s going on.
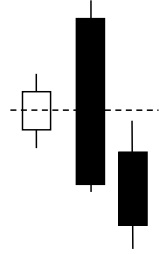
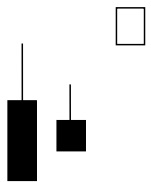
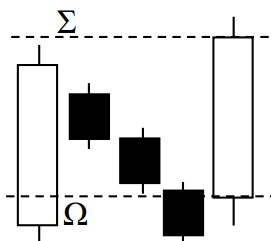
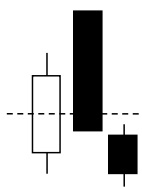 | (37) Dark Cloud Cover Just as the name implies, it consists of a long white candlestick followed by a black candlestick which opens above the high of the white candlestick and closes well into the body of the white candlestick. It is considered to be a signal of a bear market and a reversal during an uptrend. The closing price of the black candlestick should fall on the lower half of the white, which is below the halfway line. The following day they should be confirmation of a small black candlestick which falls below the line not above. |
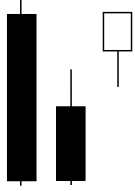
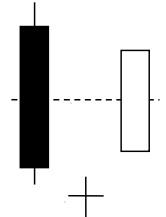
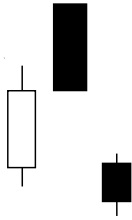 | (38) Bearish Meeting Lines This is also sometimes referred to as a Bearish Reversal, but the chances of it happening are less than Dark Cloud Cover above (37) and the effort is also weaker. Following an uptrend cycle, this pattern indicates a reversal. It shows a white candle in the uptrend is long enough, followed by a long enough black candle with the closing price equal to the closing price the previous day. The confirmation sometimes falls on the 4th or 5th day as opposed to the 3rd day. |
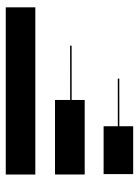
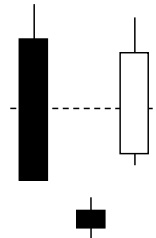
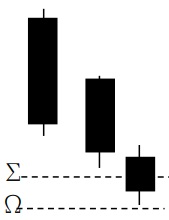
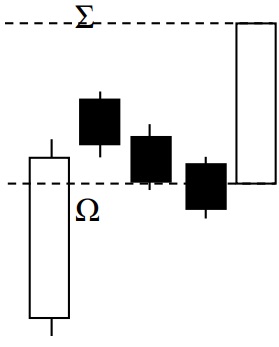
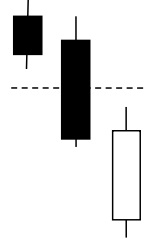 | (39) Bearish Threshing This indicates a downtrend, with one black candlestick longer than the other which shows that the downtrend is continuing. However, on day three, if a white candlestick appears but cannot reach up to half of the previous black candlestick, the downtrend is expected to continue and there is no need to have further confirmation. However, if the fourth stick is also black and under, the trend will be firmer. |
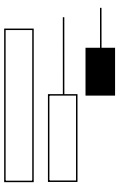
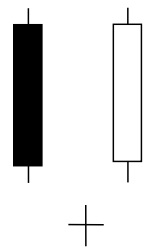
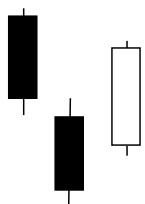
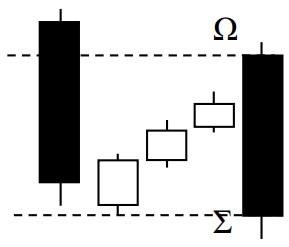
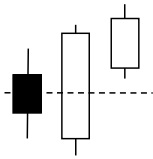 | (40) Three Outside Up This is also known as the Bullish Three Outside Up. The requirement is that following a downtrend, no matter long or short, a very small black candlestick, similar to (32) Black Spinning (p) of Allocution 5 appears. This is followed by a bigger white candle, similar to (24) Engulfing Bullish Line, and a third white candlestick, which should be above the midline of the first two days in order to form this pattern. However, when the first day is a (12) (a) Doji Small Star is also acceptable. |
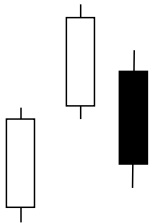
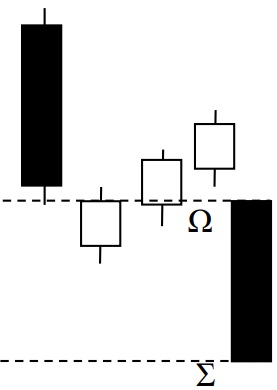
 | (41) Three Outside Down It is also known as Bearish Three Outside Down. The vital factor here is that following an uptrend, regardless of its length, a very small white candlestick appears, similar to (30) White Spinning Bottom of Allocution 5. Then a bigger black candle similar to (21) Engulfing Bearish Line, with the third black candlestick appearing under the middle line of the first two days to form this Three Outside Down. In such a case when the first day is a (12) (a) Doji Small Star is also acceptable. |
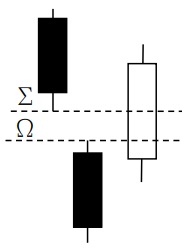
 | (42) Bullish Matching Low (a) Sometimes this is also known as “Morning Glory”. After a period of falling, two black candlesticks appear, both with the same closing price: the same bottom and only of a short shadow line underneath. The second stick is engulfed by the first, but the third stick is a Rising Hammer. This means that the long dark night has passed away, and sunshine is coming at last. When the third stick is just a white Spinning Top, the power of rising is considered weaker than a Rising Hammer. |
 | (43) Bullish Matching Low (b) Sometimes it is also known as the “Extended Dark Night” and often called Complex Engulfing Pattern, for it shows the first candlestick engulfing the second, and the second engulfing the third. But what does this mean? It is a reversal signal, and if formed with 3 sticks this indicates that that its power will be stronger than if it was formed with two sticks. However, the black sticks are shortening day-by-day which means the power of falling is weaker and reversal is quite near. Do not confuse this with Descending Triangle for it needs 2 to 3 months for formation and not just 3 days. |
 | (44) Bullish Matching Low (c) Sometimes this is also known as an “Unknown Future”. It is a variant of (35) (a) denoting an unsuccessful turn. Beware that there are plenty of reversal signals, some are successful and some unsuccessful. The first stick is a big white candlestick, the second is tapered, and the third pops up but in an Anti-Rising Hammer. This indicates that the first day was positive, however, day two hasn’t gone well, whilst the third day may not have started well, but has proven to be good at last. Therefore, it’s important to refer to practical market situations to see the further development, which can be on either side. |
 | (45) Bullish Matching Low (d) Sometimes it is also known as “Marching to Light” or “Hallo Sunshine”. After a series of drops, there come three white candlesticks, each one growing larger than before, but starting at the same point, which reflects the opening price, however, indicating that the closing prices reach higher every day. It is also a Complex Engulfing Pattern, which shows that after market close good news has been digested and therefore the pattern has returned to original opening price but will nevertheless still soar up by closing. It denotes that the future rising trend will be promising, for sellers already have been kicked off. |
 | (46) Tweeter Tops (a) Tweeter means a loudspeaker with a high tone who grabs peoples’ attention. Whilst it may not be important, this is a warning not to be neglected, for it denotes a minor change. At present it is minor, but in future could be more important. This indicates that following a several days high, the top is the same, however the low is higher, and the effort is diminishing. This depends on how it is formed with various black and while sticks and also other patterns. |
 | (47) Tweeter Tops (b) What happens if the third stick of a Tweeter Top is black? If it is a flat top where all of the highs are the same, it denotes a small resistance is present and waiting for breakthrough. When the low is higher day-by-day it should be treated as a rising trend at first, however, if it’s unable to go further up and the closing price is lower, it shows that the rising power is weaker and may even turn down. This can be an indication that the resistance is stronger and hard to break. Regardless of this and whether the breakthrough is success or not, it is a minor trend. |
 | (48) Tweeter Tops (c) When 3 black candlesticks group together with a flat top and each closing price is higher day-on-day, it is a good trend but not as strong as (46) (a), because when (48) precedes the (46), this shows an ideal trend of rising and the forecast is considered more reliable than just a single pattern. |
 | (49) Tweeter Tops (d) This is a stronger reversal pattern than (48) (c) but is at the bottom of the wave and indicates that during the first two days following opening, the price dropped, however, on the third day it rose, indicating that the turning point is ever nearer as even the tops are the same. |
 | (50) Bullish Homing Pigeon The white stick is a pigeon and therefore leaving the dark area indicates flying back home. It comes out after a series of falling and a black candlestick, however, beware that this stick should not be too big, and its volume should not be too large. It also shows a small candlestick even lower than the shadow lines which is engulfed by the previous. The third day need to have a large gap with larger transaction volume. If this is the case, the trend will continue to rise, otherwise it could turn downwards or morph into another pattern. |
 | (51) Star (a) Bullish Morning Doji Star This star and the following stars are actually short crosses where their vertical length roughly equals their horizontal width. For this pattern (51), when in a downward trend the first stick is a long black candlestick, the second is a Doji below the previous candle body and the highest price is above the previous candle low price. The third is a white candle with the body totally above the previous star. Beware that the closing price should be above the mid-point of the first candle body. It is known as Bullish Morning Doji Star and considered as a reversal trend. |
 | (52) Star (b) Bullish Morning Star It is actually a variant of the previous (51) (a) pattern, but the previous Morning Doji shows that the market is indecisive, and transactions are normally shrinking, however, this (b) pattern means the transactions are more active than previously. Market sentiment is more aggressive and in a cautious optimistic manner. Therefore, it can be said that this is more reliable than the (a) pattern. The second stick should refer to (31) and (32) Black Spinning Top or Bottom or Standard for further observations. |
 | (53) Star (c) Abandoned Baby Bottom It is also known as Bullish Abandoned Baby, a three-bar reversal pattern that develops after a down leg. It shows a gap has occurred and is followed by a Doji small star, meaning that an upward gap then occurs on the next bar leaving the Doji “abandoned” at the low. Beware that abandoned baby means that it has been rejected by its parents – a black and a white stick with the same bottom, one with a Falling Window (35) and another with a Rising Window (36) which equal one another. But the third white stick must be long enough, and the gap must be wide enough. |
 | (54) Star (d) Abandoned Baby Top It is also known as Bearish Abandoned Baby, a three-bar reversal pattern that develops after an up leg. When a gap occurs and is followed by a Doji small star. A down gap then occurs on the next bar leaving the Doji “abandoned” at the top. Beware that abandoned baby means that it has been rejected by its parents – a black and a white stick with the same bottom, one with a Falling Window (35) and another with a Rising Window (36) which equal one another. But the third black stick must be long enough, and the gap must be wide enough. |
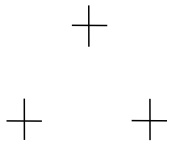
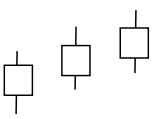
 | (55) Star (e) Tri Star Bottom This is also known as Bullish Three Star Doji. It is a simple pattern of Three Doji Stars, however, unlike a typical reverse pattern which typically needs a white stick, this doesn’t. Normally a Doji star denotes that the market sentiment is indecisive or directionless, and 3 stars grouped together seldom happen when it is near the support line. Either a previous low or different kind of average line will be more indicative. It is also known as Three Star Bottom. |
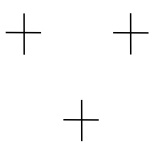
 | (56) Star (f) Tri Star Top It is also known as Bearish Tri Star Doji. Basically, it mirrors (55) Star (e) and focuses on the gap, which should be wide enough but not too wide. Additionally, it’s important to observe the previous range and serval highs or the various average lines which we’ll discuss in the next Allocutions. As for the star itself, its horizontal lines which reflect the opening and closing do not need to be in the middle but can be slightly clinging up or down. However, they should not be on top or bottom of the vertical sticks. It is also known as Three Star Top. |
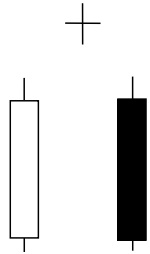
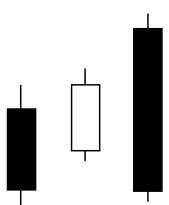
 | (57) Bearish Sandwich Sticks The term Sandwich is easy to understand – it denotes two identical sticks either side of a middle stick which is different in color and size. This shows a reversal trend. In an uptrend there are three major sticks – the first is a white candlestick, long enough and with a closing price near the all-day high. The second stick is a black stick with an opening and high price lower than the first one, and the closing price lower than the previous opening price. The third white stick engulfs the second totally with a closing price the same as the first one. It is a bearish signal, however, it’s wise to wait and observe the closing price under the third to confirm this trend. |
 | (58) Bullish Sandwich Sticks It’s a mirror of the above (57). The low of the first and third should be the same, and the third black stick should engulf the second white candlestick. The breakthrough needs confirmation, but not necessarily on the fourth stick, and sometimes will be on the fifth or sixth stick. When it doesn’t appear on the fourth stick, one should be cautious that the patterns do not transfer to another format. It’s better to cope with Technical Indicators which will be presented in the coming Allocutions. |
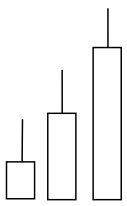
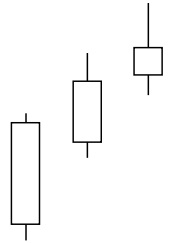
 | (59) Three White Soldiers It is also known as Three White Flowers or Three Small White Flowers. After a bearish or a sluggish trend which goes horizontally, if there is a sign that three small white candlesticks are going up one by one like a staircase, all high, low, open and close are higher than previous, it shows the rising power is aggregating gradually and paving a beautiful and brave path for the future. The most ideal pattern is that the price opens in middle of the previous. |
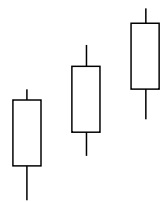 | (60) Three White Knights It is also known as Three White Trees or Three Big/Giant White Trees. It’s a variant of the previous (59) pattern. Of course, knights are bigger and more important than soldiers, just as trees are larger than flowers. Therefore, the rise can be expected larger than the previous (59) pattern. These three large white candlesticks only show a true pattern at the bottom or midway, if it is at top of a wave or the candlesticks are too long, you’d see a counter effect because of meeting extremes. The ideal pattern is also in the shape of a ladder, with the opening price halfway. As a rule, most of these patterns need confirmation, meaning the coming stick should continue the trend and be the same color to confirm, regardless of whether it’s black or white, up or down. |
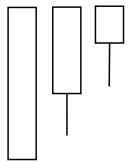
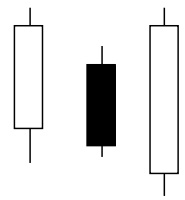
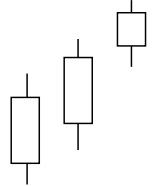 | (61) Bearish Deliberation It’s a variant of the previous two patterns of (59) and (60). It appears after a long trend of rising, and denotes the end is near, but not necessarily now as the rising power is diminishing. As standard there are two white candlesticks large which aren’t that large – the first and second are of same size, the second opens about halfway through the body of the first, but the third white stick is diminishing and can be in form of Spinning Top (29), Spinning Bottom (30), or Doji star (12) (a). It is treated as a reverse signal of an uptrend. |
 | (62) Advance Block (Bullish to Bearish) This is a variant of the previous three patterns of (59), (60) and (61). After a series of uptrend, the rising power becomes weaker day-by-day. The next two days are white candlesticks with each closing above the previous day’s close and having an opening within the range of the previous day’s body. The most important point is that the last two days have long higher shadows than the first, and similar to a rising hammer seen in (5). This denotes the end is near, even if there is still rising. |
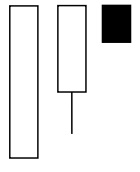
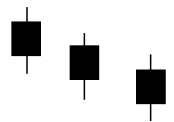 | (63) Three Black Crows Patterns (63) to (66) are mirrors of (59) to (62), respectively. The focus that Three White Flowers (59) should be on the ground means that after a falling trend of a sluggish range running horizontally, Three Black Crows (63) should be on the tree, indicating the top of a wave, however, requiring that one crow is lower than previous or else it is not such a pattern. Crows must be small relative to the tree; therefore, these three black candlesticks should not be too large and comparatively be the same small size. Thus, it denotes a longer but slower trend of downfall. |
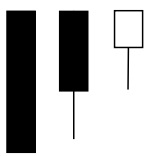
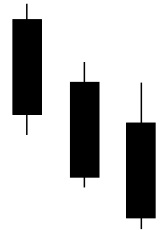 | (64) Three Black Eagles The Three Black Crows (63) and Three White Flowers (59) are smaller in size, but eagles of course are larger than crows. However, Three Black Eagles also known as Three Black Knights and should be high in the air which comes on top of a wave where three big black candlesticks which are large enough, lead the fall. This means the falling trend will be deeper and longer than (63) and come earlier than (63). But should not be too long, or else when extremes come, it will bring a rebound as in (60) Three White Knights which is a mirror pattern of this. Beware that in these patterns, the shadow line of the last candle is very decisive. That is when it is an Anti-Falling of Falling Hammer and can decide the speed of confirmations. |
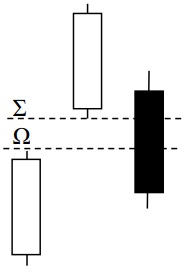
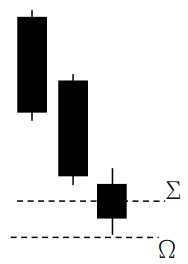 | (65) Bullish Deliberation Here it’s better to explain the strategy of stop loss and buying in than repeating the mirror pattern of (61). After a falling trend two similar black candlesticks denote the power is still great, but the third has diminished the power, so when the fourth days comes if the price is on the upper half of the third stick, then it is a buying signal. But, be sure that the stop loss is the lowest shadow line level of the third dayΩ. This also applies to the mirror pattern of (61) and other similar patterns. |
 | (66) Advance Block (Bearish to Bullish) Some call this the Bearish Advanced Block, because it stops the fall, however, some call it the Bullish Advanced Block, for after the block it may go bullish. The term isn’t that important, however, the writer uses the term of Advance Block (Bearish to Bullish), when readers may notice other people using the previous terms or even other names. The important thing here is to concentrate on the essence, as everyone can invent more beautiful names. This is a mirror pattern of (62). Mind the buying signal Σ and stop loss Ω are as in (65). |
 | (67) Downside Gap Three Methods This is a trend of continuation and not reverse. In a downtrend you see two black sticks – the low shadow line of the first can overlap the high shadow line of the second, but the body of the second cannot overlap the shadow line of the first. The third white candle opens within the body of the second and closes within the body of the first. The first candle indicates a downtrend and second reconfirms, but the third is a rebound to fill the gap and means the down trend will continue hereafter. |
 | (68) Upside Gap Three Methods This is a mirror pattern of item (67), and it’s important for investors to understand the psychological status of the market. The rally of uptrend continues on the first candle in a healthy session, with the close well above the opening – generating a wide range real body. This increases the bull’s confidence to generate the second candle, with the third being a profit-taking candle. In an uptrend, a healthy continuation will only occur when profit-taking is completed. This is the essence of items (67) and (68). |
 | (69) Downside Tasuki Gap (Real Gap) This pattern develops from item (67) and (68) and is a continuation pattern. Some would say (69) is also a variant of this. There is a clearer gap here, thus is also known as Real Gap. The level between Σ and Ω is known as Tasuki Gap. When this gap is filled, it does not indicate a reversal, but rather a continuation, because profit taking has been completed. Be aware that the gap must be wide enough in order to let the digestion on the third stick occur thoroughly, but not too wide or else it will lead to a counter effect that is too large to fill. |
 | (70) Upside Tasuki Gap (Real Gap) From (67) to (69) are of the same category in mirror patterns or variants. The last stick should simply be the opposite color of the second, meaning that before and after the gap should be different colors. This means it’s strong enough for profit-taking no matter how long or short orders and a gap filling is for continuation and not reversal. The third stick that is after the gap must cover the upper half and lower half of the body before the gap regardless of whether there are white or black sticks. It is also known as Real Gap. |
(71) Bullish Ladder Bottom
Beware that the name of this term has a slight contradiction, for bullish should indicate rising, therefore, why would there be a bottom? When consulting the basic pattern in Figure (i), it indicates that the pattern is at the bottom of a wave, and ladders are leading downward.

Figure (i) Basic pattern of Bullish Ladder Bottom
Bullish Ladder bottom is a five-candle bullish reversal pattern that occurs at the end of a bullish trend, which means this “bottom” can be at the top or bottom of a wave and therefore, do not be misguided by its name. The “bottom” is just at the low of this five-stick pattern. The four first candles are bearish and followed by a positive candle that starts with a positive gap.
The first three are black candlesticks similar to (64) Three Black Knights, and the fourth is a Falling Hammer of Pattern (6), but this version should be with a longer upper shadow line and no lower shadow line.
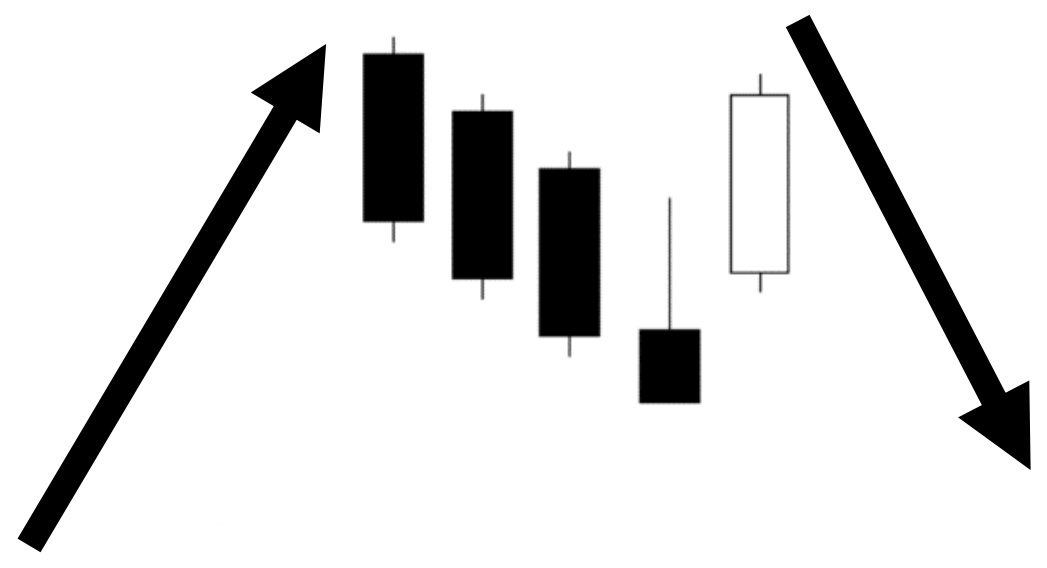
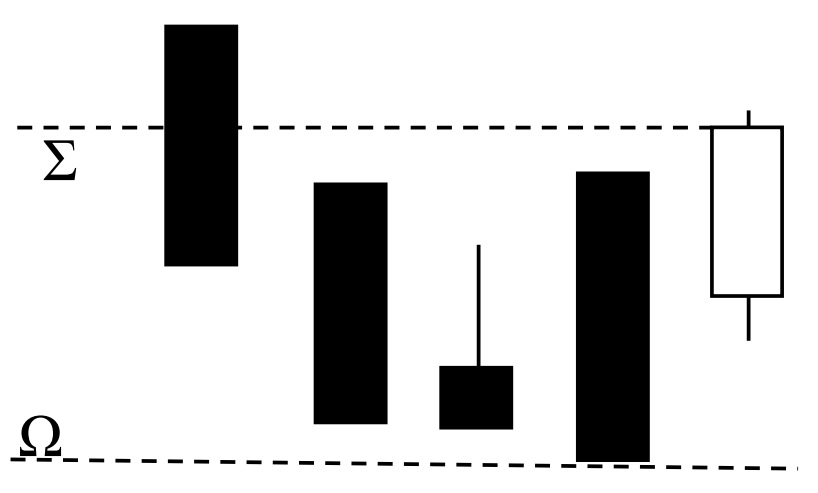
Figure (ii) On top of a wave
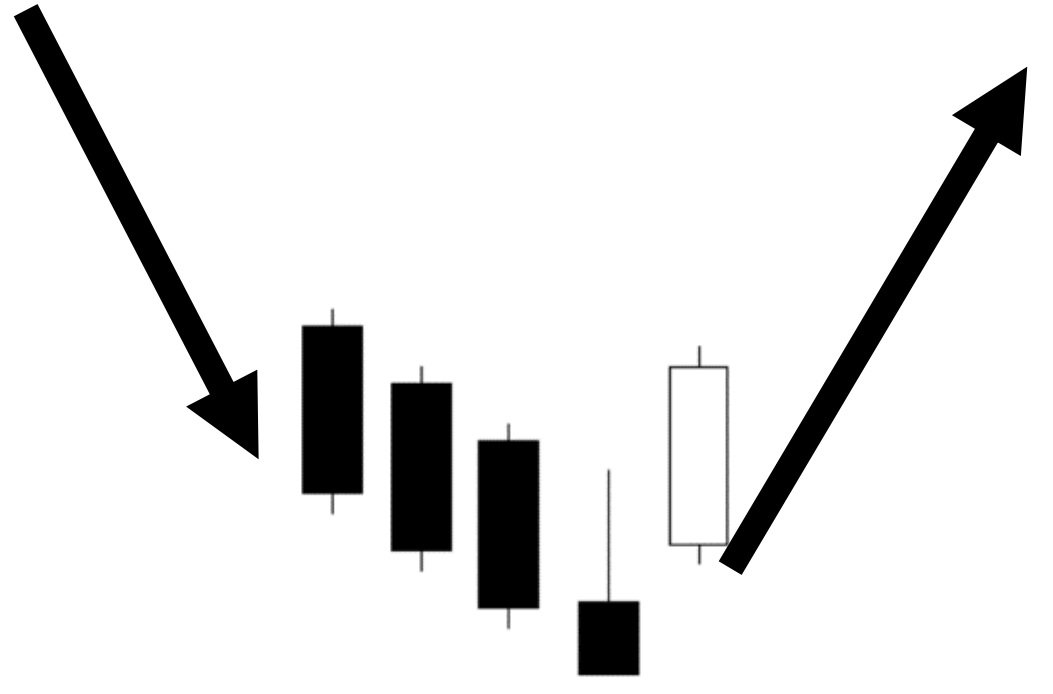
Figure (iii) On bottom of a wave
This is a bi-lateral pattern and when it appears on top and bottom of a wave it has different meanings. Figure (ii) denotes a rising trend, and Three Black Knight (64) come and are confirmed by a Falling Hammer (6). However, this gap is not a real gap, for the shadow lines in the 4th and 5th sticks overlaps, so the power is not as strong as in the Tasuki Gap of (69) and (70). Since the 5th white stick cannot go over the previous high it is a reversal trend and turns bearish. Figure (iii) is on the bottom of a wave, and the 5th stick goes over the 4th and 3rd and even maybe the 2nd stick, so it’s a reversal trend of going up. Beware that this pattern must cope with the transaction volume increasing from 1st to 5th stick and the 5th should be significantly larger than the previous.
(72) Bearish Ladder Top
Even though this is a mirror pattern, it can be a little complicated, so please go over the definition and explanation word by word even though it may be monotonous.
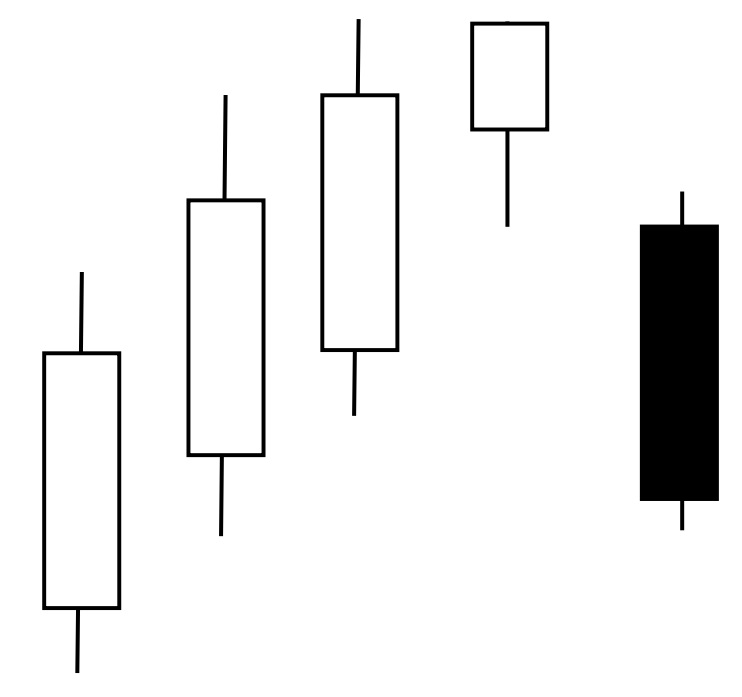
Figure (iv) Basic pattern of Bearish Ladder Top
Bearish Ladder Top is a five-candle bullish reversal pattern that occurs at the end of a bullish trend and means this “top” can be at the bottom or top of a wave, so do not be misguided by its name. The “top” is just at the top of this five-stick pattern. The four first candles are bullish and are followed by a negative candle which starts with a negative gap.
The first three are white candlesticks similar to (60) Three White Knights and the 4th is a Rising Hammer of Pattern (4), but this version should be with a longer lower shadow line and no upper shadow line.
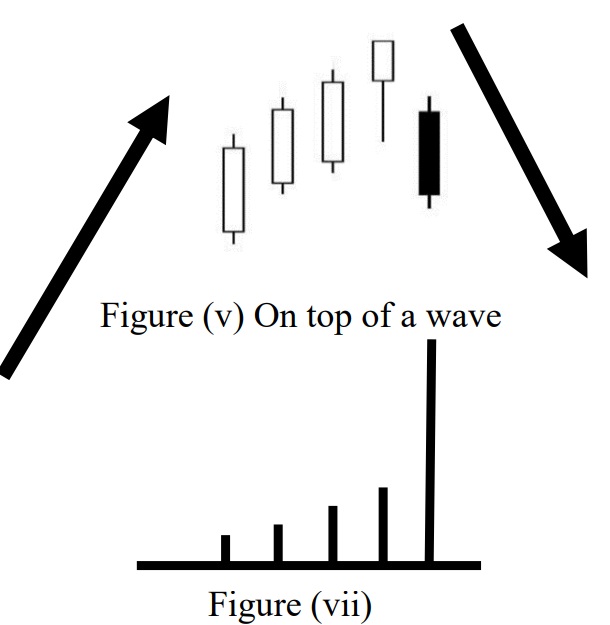
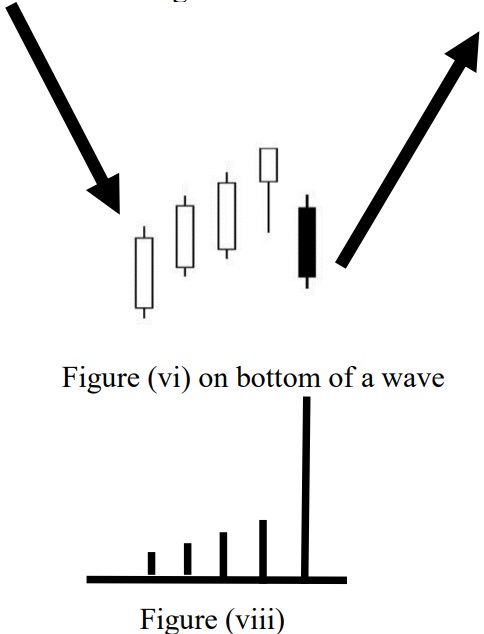
This is a bi-lateral pattern, and when it appears on top and bottom of a wave there are different meanings. Figure (v) denotes in a rising trend and Three White Knights (64) come and are confirmed by a Falling Hammer (6). However, this gap is not a real gap, for the shadow lines of the 4th and 5th sticks overlap, so the power is not as strong as in the Tasuki Gap of (69) and (70). Since the 5th black stick goes down below the 4th and 3rd and maybe even the 2nd, it is a reversal trend and goes bearish. Figure (vi) is on the bottom of a wave and the 5th would not go under the 1st so it’s a reversal trend of going up. Mind that this pattern must cope with the transaction volume increasing from 1st to 5th stick, and the 5th should be significantly larger than the previous, as shown in Figures (vii) and (viii).
(73) Bullish Three Line Strike
When at an Advanced Level, it’s not as simple as the elementary level. This is what we call extremes and will bring about changes or reversal – it’s the market discipline. A big black candlestick in elementary level surely denotes a fall, but in advanced level can denote a rise sometimes. In chart analysis investors have to find out which position is a normal case and which position is an exceptional case. The Bullish Three Line Strike is one guideline.
This is a pattern of continuation and not reversal. It’s formed by four sticks and the first three are in the shape of Three White Knights (60), with the fourth being a big black candlestick which engulfs the previous three sticks. Please refer to (21) Engulfing Bearish Line that even a big black candlestick engulfing a single white candle can be treated as the reversal, but why engulfing three is a continuation? Also in the (60) Three White Knights, it needs confirmation. Investors do not need to memorize this, just to understand it.
The 4th stick, which is the big black candlestick, is a pullback as in the pullback of the Ascending Triangle of Allocution 3. It is because the Three White Knights (60) generate a lot of buying power and they need to be digested before rising further. That means the market is overbought, but the market sentiment is still bullish. So, when the price suddenly goes down, it will attract more buyers and continue the bullish trend. In this situation, besides following the world news, you can observe to see if the transaction volume is diminishing gradually. This is the buying power in the Three White Knights (60), which becomes less, and above all, the big black candlestick is not so much to know the market sentiment, it is not to push down the product as in the following Figure.
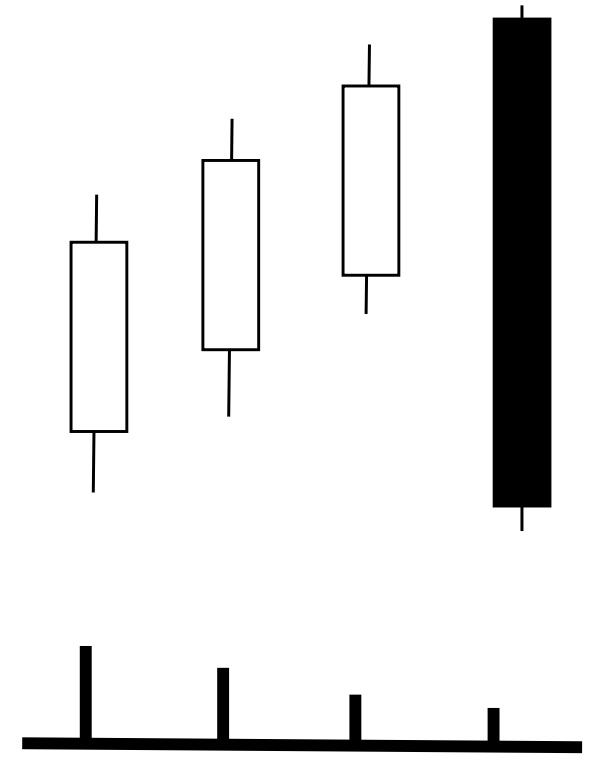
Figure (ix) Bullish Three Lines Strike & volume of transaction
When this pattern is formed, of course, it also needs confirmation. This should be the coming stick opening higher than the closing of the big black candlestick – with the low higher than the close. It should be a white candlestick no matter how large or small, but normally not so large, for buyers are very careful after a big drop and afraid of a further drop, therefore the rise will be slow and steady.
(74) Bearish Three Line Strike
A bearish three-line strike is a four-candle continuation pattern that forms in a bearish trend. The first three candles are bearish, whilst the last candle is positive and closes above the highest close of the previous three candles. It’s the mirror pattern of the (73) Bullish Three Line Strike. Since a single candlestick is not as reliable and can only serves as a base for Complex Patterns, thus we have to study more combination in order to increase accuracy.
This is a pattern of continuation and not reversal. It is formed by 4 sticks and the first three are in the form of Three Black Eagles (64), with the fourth being a big white candlestick engulfing the previous three sticks. Please refer to (24) Engulfing Bullish Line that even a big white candlestick engulfing a single black candle can be treated as a reversal sign. However, why is engulfing three a continuation? Also, in the Three Black Eagles (64), it needs confirmation. Investors should therefore understand this as opposed to memorizing it.
The 4th stick, which is the big white candlestick, is a pullback similar to the pullback of Descending Triangle of Allocution 3. It is because the Three Black Eagles (64) generate a lot of selling power and they need to be digested before going further down, meaning the market is oversold, but sentiment is still bearish. Therefore, when the price suddenly goes up, it should attract more sellers and continue the bearish trend. In this situation, besides observing global news, it’s also important to observe the volume of transition, which should be diminishing gradually. That is where the selling power in the Three Black Eagles (64) is becoming less, and above all, the buying of big white candlestick is not so that the market sentiment is not to buy up the product as in the following Figure.
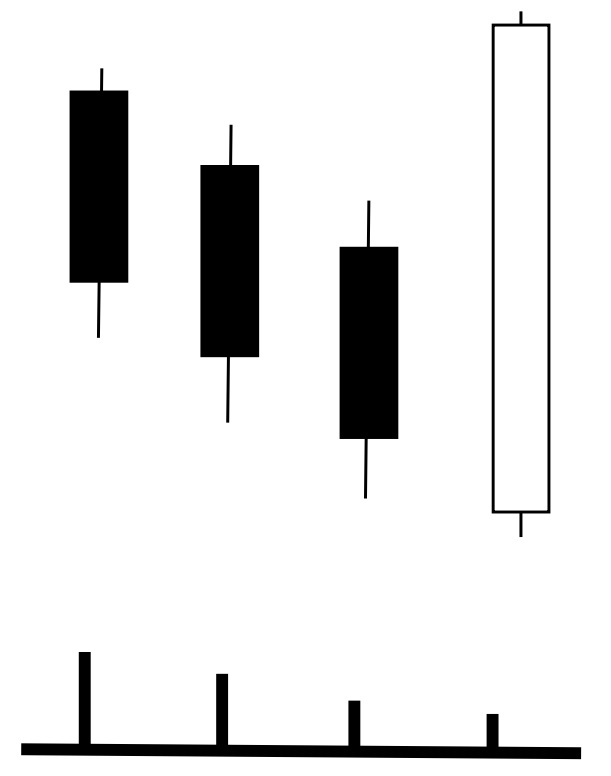
Figure (x) Bearish Three Lines Strike & volume of transaction
When this pattern is formed, of course it also needs a confirmation, which is shown by the stick being lower than the closing of the big white candlestick indicating that the high should be lower than the closing. It should be a black candlestick no matter how large or small, but normally not so large, for sellers are very careful after a big rise and afraid of a further rise, therefore the decline will be slow and steady.
(75) Bullish Concealing Baby Swallow
The occurrence of Bullish Concealing Baby Swallow normally is at the bottom of a wave and signifies a reversal. It is different form the Abandoned Baby Bottom (54). The first two days of the Concealing Baby Swallow Pattern are the two black Marubozus of item (2). The third candle is bearish, has long upper shadow, and opens with a gap down from top of second candle. The high of the third candle is greater than the second candle’s close. The fourth candlestick completely engulfs the third day and closes near its low. The first two sticks denote market sentiment is bearish, whilst the third tried to rise but fails. The fourth is big and black again and doesn’t matter whether it’s Marubozus or not. An extreme oversell leads to a reversal and therefore let’s concentrate on trading method. Basic pattern is shown in Figure (xi) underneath.
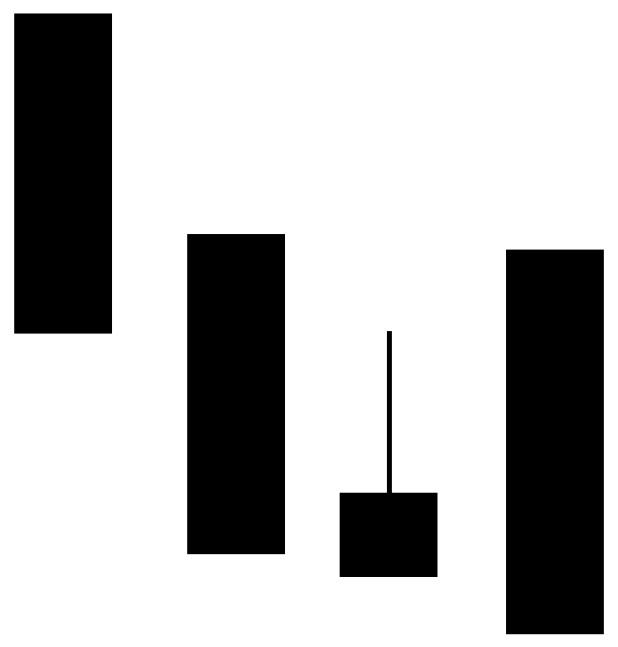
Figure (xi) Basic Pattern
(Figure xii) Trading Method
The buying signal is not within the basic pattern and it needs a confirmation on the fifth day and should be near the market closing or on the sixth day of market opening at Σ if it is still near or above the closing of the fifth. However, the stop loss should be just under the low of the fourth day at Ω.
(76) Bearish Concealing Baby Swallow
The occurrence of Bearish Concealing Baby Swallow normally is at the top of a wave and signifies a reversal. It is different form the Abandoned Baby Top (54) (d). The first two days of the Concealing Baby Swallow Pattern are two white Marubozus of item (1). The third candle is bullish, has long lower shadow and opens with a gap up from the second candle. The low of the third candle is greater than the second candle’s close. The fourth candlestick completely engulfs the third day and closes near its high. The first two sticks denote market sentiment is bullish, whilst the third tries to fall but fails. The fourth is a big white again and doesn’t matter whether it’s Marubozus or not. A period of extreme overbuying leads to a reverse so let’s concentrate on trading method. Basic pattern is shown in Figure (xiii) underneath.
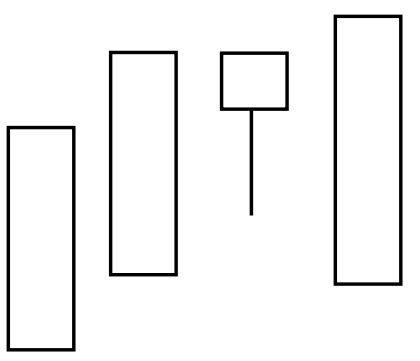
Figure (xi) Basic Pattern
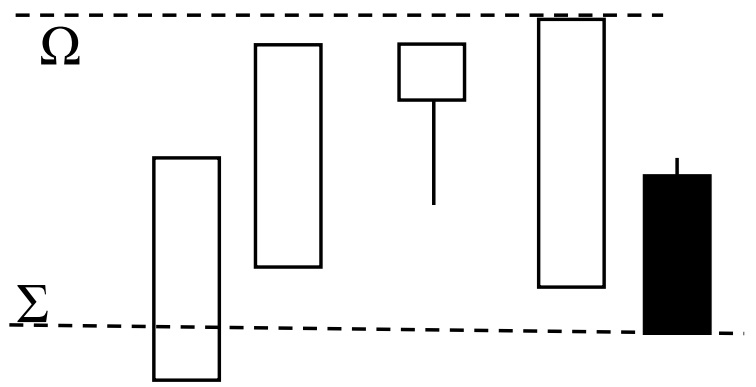
Figure (xii) Trading Method
The selling signal is not within this pattern and it needs a confirmation on the fifth day and should be near the market closing or on the sixth day of market closing at Σ if it is still near or below the closing of the fifth. However, the stop-loss should be just above the high of the fourth day at Ω.
 | (77) Rising Three Method This is a five-stick pattern of continuation, or rather renewal. In a bullish |
 | (78) Bullish Mat Hold This is a variant of the above (77) pattern, but denotes a stronger rising |
 | (79) Falling Three Method Even though this is a mirror pattern of Rising Three Method (77), mind that three white candlesticks are not the same as the above, it is in the form of the Funnel Shape of Allocution 4. It can be in the form of Three White Flowers or Soldiers of (59) or in the varying form Funnel Shape. Anyway, this is a form of continuation or renewal, showing the market after a short period of consolidation and restarting the downtrend. When the Funnel Shape appears, it means the fifth stick will come very soon and very strong. Mind that the buying signal is still at Σ, but the stop loss should take care, it is not at the end of Three White Flowers or Soldiers of (59), but at top of the fifth black stick which is Ω. |
 | (80) Bearish Mat Hold It is also known as Inverted Mat Hold or Reverse Mat Hold – a mirror pattern of (78) Bullish Mat Hold. Mind that the three small sticks can be in any form – the standard form of Three White Flowers (59) or the Trumpet Shape of Funnel Shape of Allocution 4, and you may even witness the further development of four or five sticks. Even if in individual pattern of Spinning, it can have Spinning Top or Bottom, Black or White altogether in four formats as shown in (29), (30), (31), (32) of Allocution 5. One more point to be aware of is the selling signal is at Σ the close of the fifth stick or open of the sixth is it is still around that price. The stop-loss is at the top of the fifth stick Ω which is the opening price and not at top of the fourth stick. |
(81) Bullish Hikkake Pattern
The Hikkake (ひっかけ) in Japanese is to catch, trick or snare, but sometimes this pattern is also known as a Trap Pattern. The concept shows a short-term decrease in market volatility, followed by a breakout. As in the Chart Patterns (A) and (B), after studying basic patterns for Allocutions 3 and 4, there is information on how to find out the traps explained in Allocution 4. Now, when near the end of Candlesticks, we also have to observe at least one or two traps. All patterns, when without confirmation, can be a trap. The Hikkake is a fake-out move and then a reversal-and-breakout move. The pattern appears to work based on investors’ expectation of the price moving one way, and then collectively bailing out as the price reverses. The basic pattern is shown in Figure (xiii).
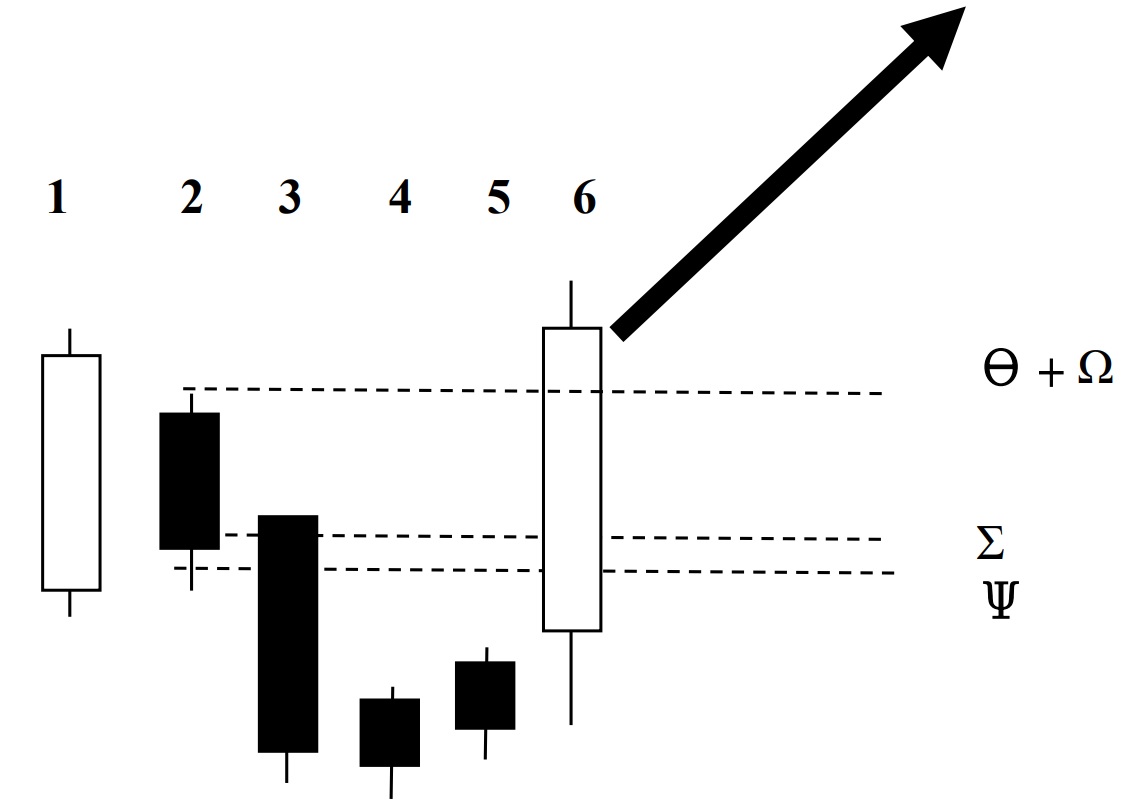
Figure (xiii) Basic Pattern of Bullish Hikkake
Sticks number 1 + 2 are known as the inside bar – please refer to Bearish Harami (19) of Allocution 5, as this denotes a falling trend. Some people will sell on day 2 near the day end at Σ, whilst some may sell at day 3 opening Ψ when it opens near the previous close and continues to drop. However, on Day 4 and 5 even though it’s still a black candlestick, you should see a slight upward move. On Day 6, some news could make it soar suddenly, therefore, those that had sold at Σ or Ψ should have the stop loss at Ω, whilst investors newly entering the market should buy at Θ.
Nota Bene
Even though the Bullish Hikkake Pattern has its mirror pattern of Bearish Hikkake Pattern, the Bullish Pattern is more often observed, which means its accuracy is higher than the Bearish Pattern. Mind that for mirror pattern, it is not necessary to have an exact one-to-one mirror effect. Such as in Chart Patterns, the Ascending Triangle is more accurate than the Descending Triangle. Very simply, before the great rise, the market is stagnant and calm, and market behavior and activities can come out regularly. But when on top of a wave, market sentiment is hot and furious, and a slump usually brings on panic selling, so a lot of things will be out of order and will not follow an original path. Thus, investors should pay special attention to mirror patterns and add on the factor of market sentiment, for no charts can stand alone without referring to the live market.
82. Bearish Hikkake Pattern
This is a mirror pattern of the item (81), but not 100% a mirror, as the first two sticks are the same as item (81) but not the third, which is in reverse. We first go through the basic theory and then have to find it out in the mist. The basic pattern is shown in Figure (xiv) underneath.
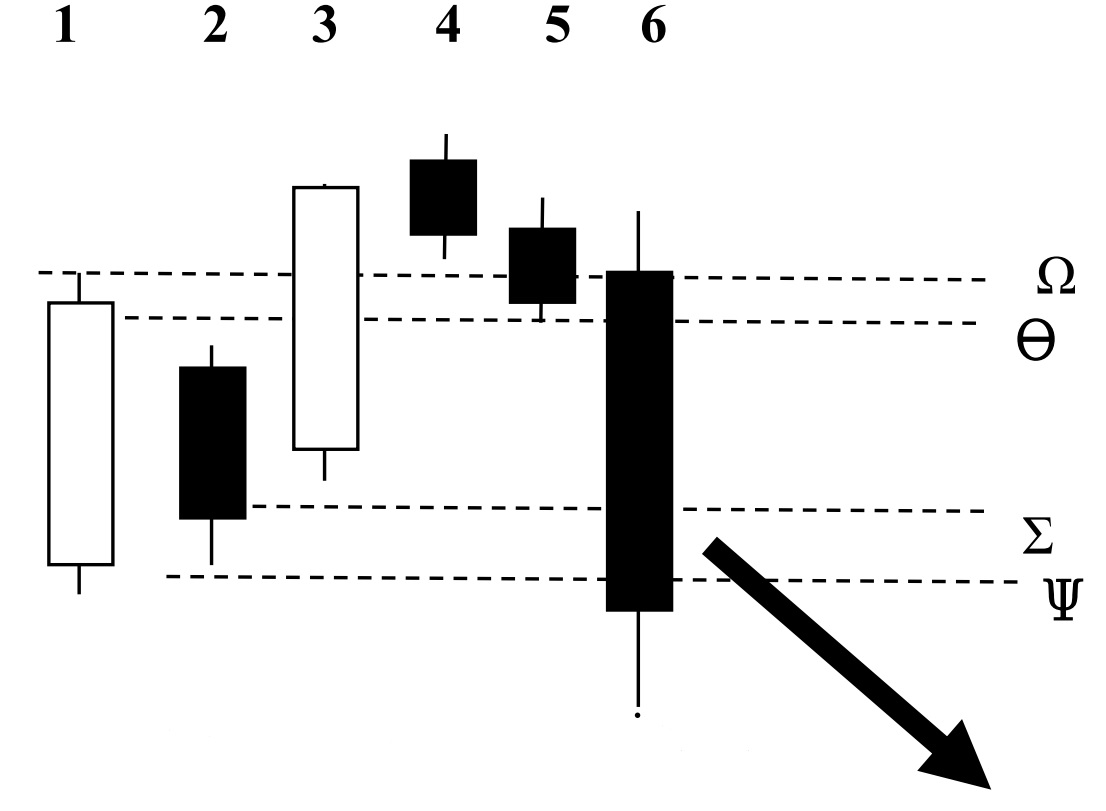
Figure (xiv) Basic Pattern of Bearish Hikkake
For sticks number 1 + 2 are known as the inside bar; please refer to Bearish Harami (19) of Allocution 5. These two sticks are the same as in item (81) and denote a falling trend. Some people may sell on day 2 near the day end at Σ, but day 3 it is different from (80), as it opens higher and is not a confirmation, so investors should not sell. Those selling should liquidate at the high of the first day, which is Ω. However, on Days 4 and 5 these two small black candlesticks are moving downward slightly, and you have to observe whether it is the pattern of Spinning Top or Bottom as in item (31) or (32). On Day 6, maybe some news can make it suddenly drop. The buying signal is at the close of the first day which is Θ, and those that cut loss should buy back here. For new entrants to the market should buy at Ψ which is close of Day 6.
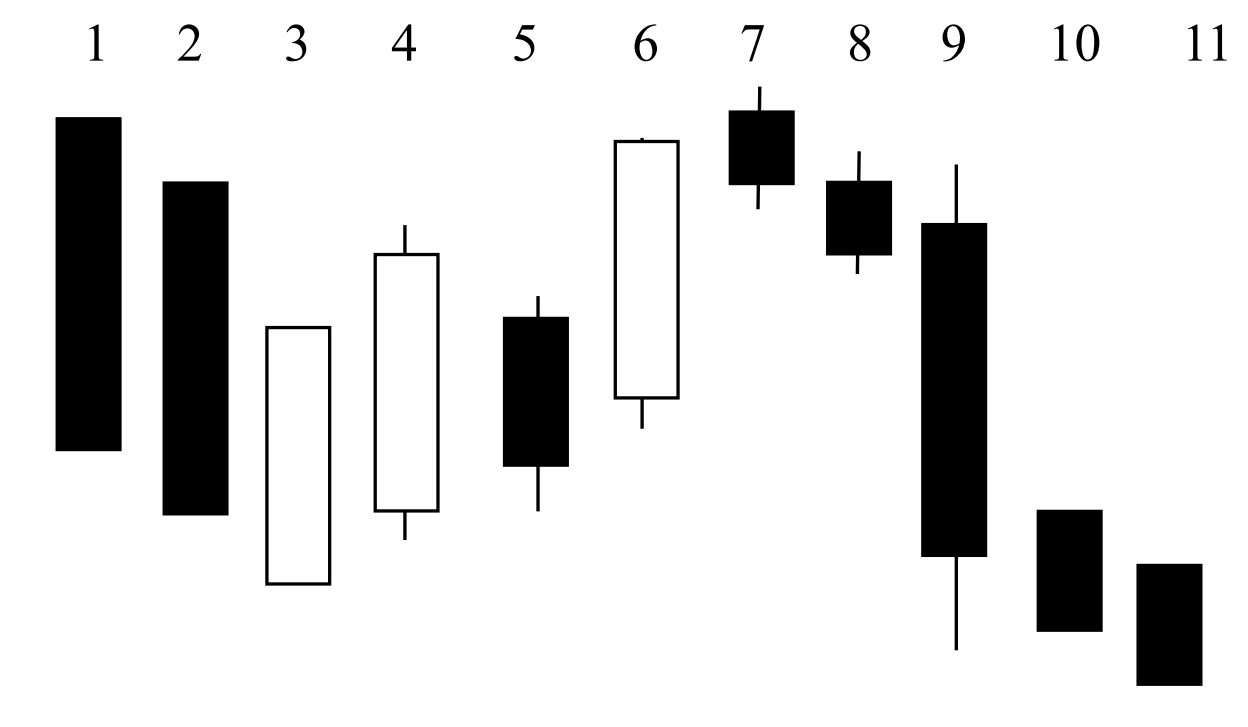
Figure (xiv) Basic Pattern of Bearish Hikkake
In order to find this pattern in a live market, you will have to find out the inside bar first, which is Days 4 and 5. Day 6 is not exactly the mirror pattern of (81), and that is why the accuracy is not the same as Bullish Pattern. When Days 7, 8, 9 continue, the pattern is finished. Day 10 is the confirmation, and some people will start selling at the end of Day 9, and some may start at the beginning of Day 10 if the opening is around the previous closing. Day 11 is just a continuation.
Candlesticks should be observed with other chart analysis, such as Patterns, Wave Theory and Technical Indicators, but we have a brief understanding of the upward and downward wave as the following Figures (xvi) and (xvii), indicate respectively:
a) Upward Wave
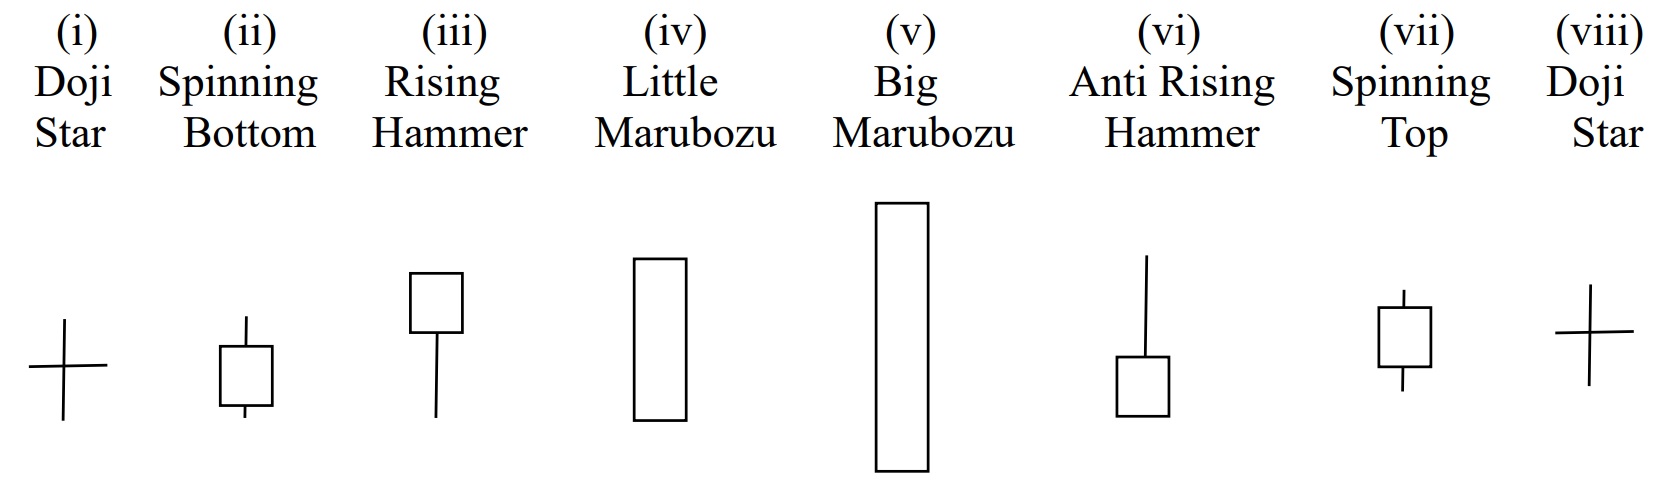
It denotes the path of a wave from low to high, from weak to strong, and then weak again. First comes Doji and grows a little stronger to Spinning but still indecisive until a Rising Hammer comes and follows a small Marubozu as confirmation of continuation. This then grows stronger to large Big Marubozu, but the effort is weaker when Anti Rising Hammer comes out even if still rising. The spinning top means the end is near and will go back to Doji soon. Of course, this is just a theoretical pattern, and live markets often don’t follow any pattern. However, it tells an investor how to find the right pattern in the right place. If the investor finds a Rising Hammer, they may be in stage (iii) or the early stage and Big Marubozu may be in stage (v) or middle of the wave. Doji may be the last stage (viii).
b) Downward Wave
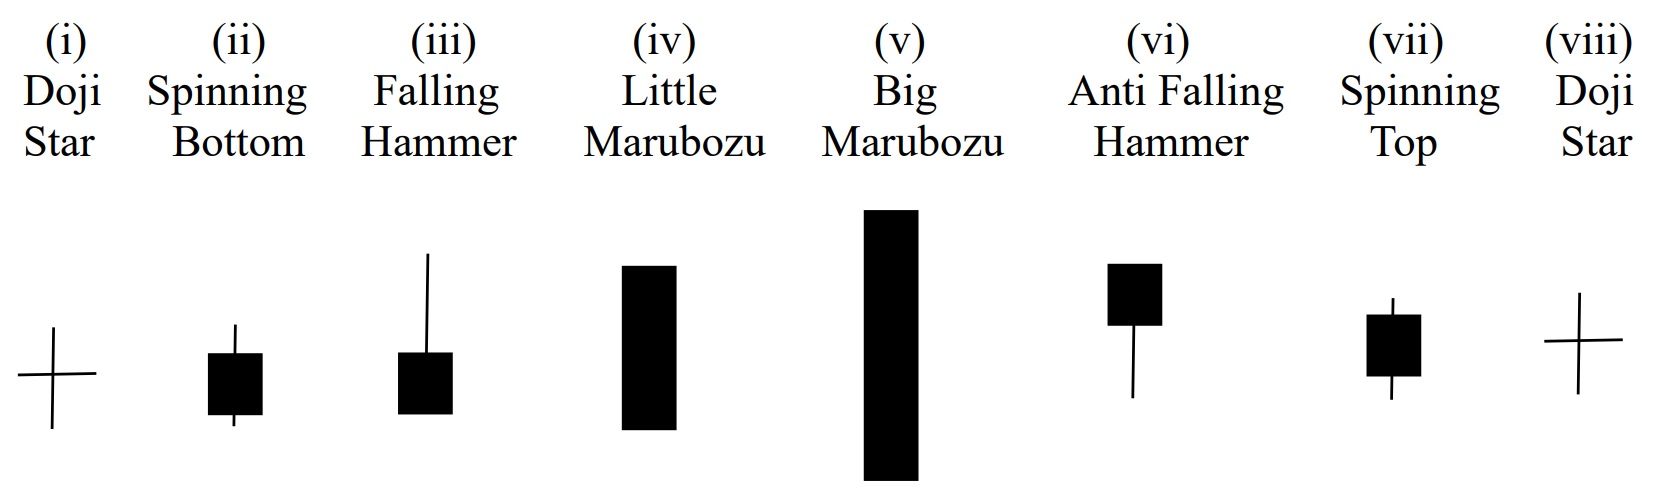
It denotes the path of a wave from high to low, from weak to strong, and then weak again. First comes Doji and grows a little stronger to Spinning but still indecisive until a Falling Hammer comes and follows a small Marubozu as confirmation of continuation. Then grows stronger to large Big Marubozu, but the effort is weaker when Anti Falling Hammer comes out even if still rising. The spinning top means the end is near and will go back to Doji soon. Of course, this is just a theoretical pattern and live markets often don’t follow any pattern. Regardless, it tells an investor how to find the right pattern in the right place. If the investor finds a Falling Hammer, it may be in stage (iii) or the early stage, and Big Marubozu may be in stage (v) or middle of the wave. Doji may be the last stage (viii).
Please note that Candlesticks are used to observe near, past and future trends, and those seeking medium term trends should use different Chart Patterns, whilst longer term you’ll need to use Wave Theory. Anyway, chart analysis cannot exist alone; it must link up with everything happening under the sun.