
Key summary:
a) Wave Theory
Since the financial market is not easy to grasp precisely, so people tend to find out some track of fluctuation, if people cannot control it, may be it is following the rules of great nature. Wave Theory is based upon such a concept, for the ups and downs of prices seemed like the wave in a sea, but how to track and trace the wave of the boundless sea in a well-organized system? Thus they accept the Fibonacci series for use in the background and Average Lines for use in the foreground.
Wave Theory has a wide acceptance because it can be used for long term, medium term and short term purpose. For long term purpose, normally it links up with the economic cycles and will be used by Think Tanks or government entities; however, still can be adapted to financial market. However, no analytical tool can exist alone no matter how powerful it is. Wave theory can merge with other tools in different stages. On top and bottom of waves can merge together with different kinds of pattern. After the turning points and on starting and ending of new trends can merge with averages lines, while for minute wave can merge together with candlestick formats. When entering into overbought and oversold zone, with the help of technical indicators can give reliable forecasts to the market. When merging with economic cycle it can analyze long term development of a society or nation.
Anyway, we have to understand the characteristic of each tool first, go deep into the core and fully utilize the advantages and skip off the disadvantages.
In the field of Chart Analysis, no tools can exist alone. All tools must be used in a way of inter-changing with each other. There is no fixed definition of which should be used together with which. It mainly depends on experience rather than theory. However, Wave Theory can also be divided into several kinds, the most popular is known as Elliot Wave, we also have Gann Wave which somewhat links up with mysticism and is not pure Chart Analysis, it is hard to say whether it’s more accurate or not, anyway a little beyond the traditional scientific method. We also have Dow’s Wave, which aims at the Psychological situation of investors and how they affect the market. Each has their own function, but Elliot Wave is concerning pure Chart Analysis and most widely used. When the term Wave Theory is used, it normally denotes Elliot Wave. It is understood, not need to point out, but the other two normally needs to be specially pointed out. Or Dow’s Wave can also be known as Dow Theory, and Gann Wave is also known as Gann Theory.
b) Average Lines
Actually, Averages Lines have nothing to deal with Wave Theory, but both of them are the most widely used tools and therefore very often used together by analysts. People put them together not because of any basic relationship, just because of their popularity. No one requested they must be put together, but co-incidentally they can always be seen side by side always. There are a lot of Average Lines in different platforms; in the NetDania chart they have 9 kinds as in the attached charts. The first one Simple Moving Average (SMA) sometimes is just called Moving Average (MA); just the same. They also have their variants which are actually more than the above.
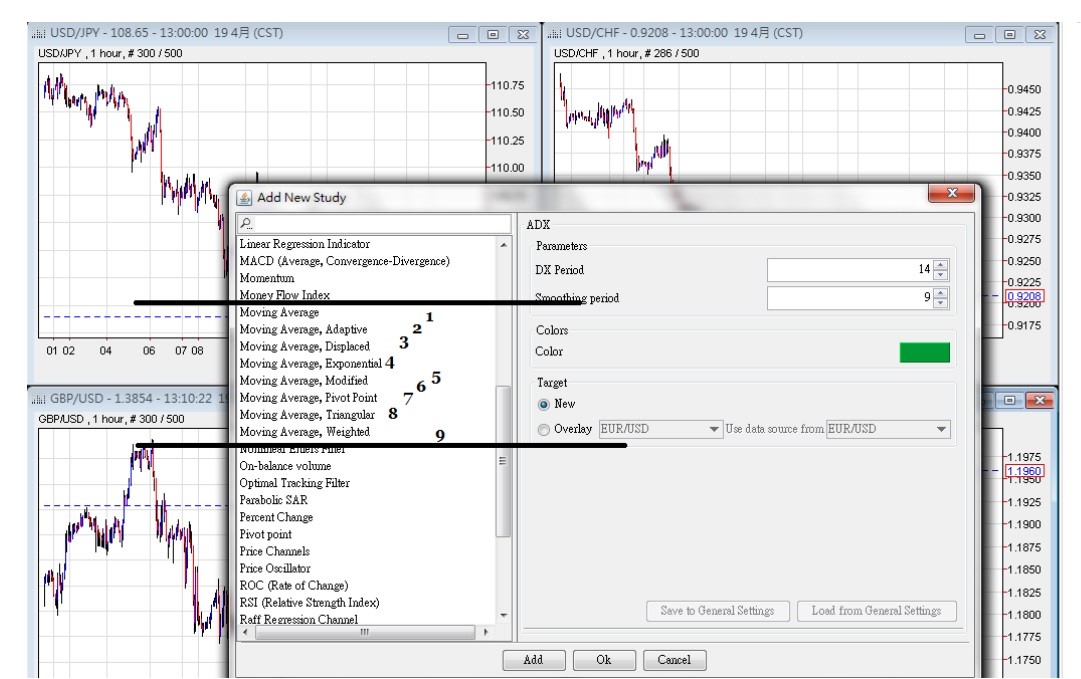
Figure (i) Various types of average lines
However, each average line can be used in form of 10, 20, 50, 100 or 250 interval period. Some may use the series of 5, 10, 30, 60, 120, 240….and some may use 24, 25 or 26; 72, 73 or 75 for medium terms and longer terms may be 200, 250 or 255 interval. Investor may ask, so which is correct or more accurate, if you can give such an answer, all other lines will be forever deleted from the internet and could not exist anymore.
Chart Analysis sometimes is like Philosophy. Philosophy is to raise a question and let others thinks for it or debate for it, not necessarily every question would have a definite answer like one plus one equals to two.
Why Elliot Wave can be used to forecast short term, medium term and long term market trends, for it has a series of 9 grades of wave. It is based upon a primary wave and further develop upward to larger waves and downward to smaller waves. Mind that the Primary Wave (or Basic Wave) is not situated at the middle of the 9 grades, it is at the 4th grade, that means when counting downward it has 5 grades smaller than it and when counting upward there are 3 grades larger than it and not in the logical ratio of 4 to 4, but 3 to 5. Some people may ask; why it is not in the middle with 4 grades upward and 4 grades downward, it should be more logical! But the logic of wave theory is 5 to 3 and then 5 to 3 and 5 to 3 more upward or downward. This is another kind of logic.
There is no fixed period or length for each grade; it depends on the formation style and structure. Thus come to the 9 grades:
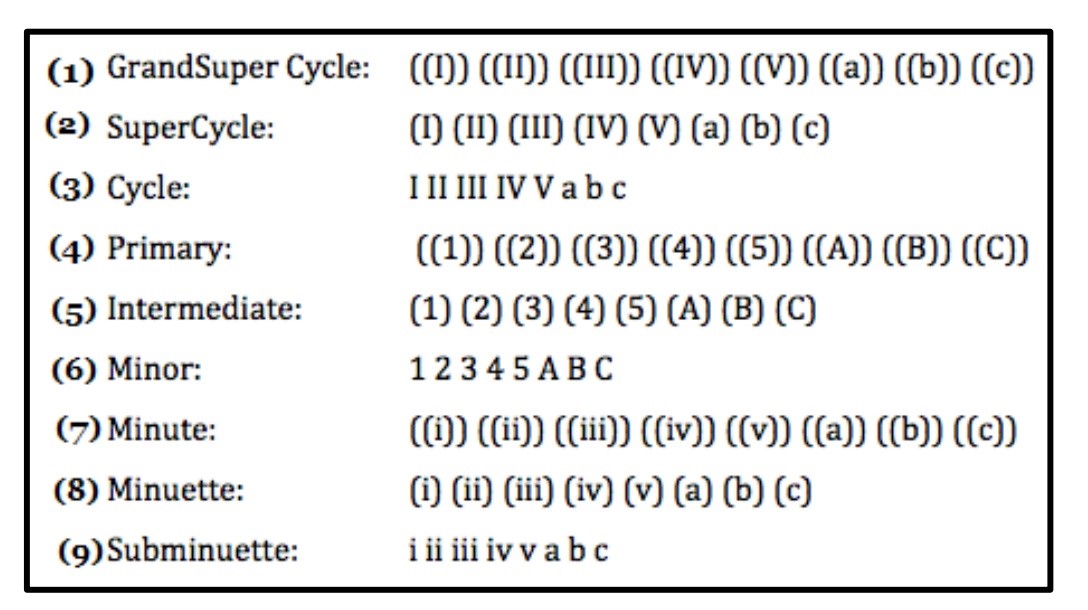
Figure (ii) Nine grades of Elliot Waves
Mind that this is the original labelling of Elliot Wave, even nowadays still a lot of analysts would not follow strictly, for if they are just showing part of the Grand Super Cycle, it is not so important. For the first 3 grades counting down from above, that is having the term “cycle”, they would use Roman capital figures and small English alphabets; for the lowest 3 wave bearing the root of “minuette”, they would use small capital figures and small English alphabets; for the middle 3 grades they would use Arabian figures and large capital of English Alphabets.
In practical usage, the grades number 3 to 5 are more used, Arabian figures are used are primary wave and when going upper will use large Roman figures and downward will use small Roman figures, but the brackets applied differs from person to person. These are known as colloquial usage, but when 9 waves are used officially, better refer to the original standard pattern.
Therefore it is not a problem and no need to argue further. Anyway, when just pick up 2 or 3 grades, the main issue is to let people understand what is the upper grade and lower grades, no need to mind the formalities so much.
a) Basic Wave
A Basic Wave is sometimes known as Primary Wave, Standard Wave or Original Wave, anyway it is the most commonly observed wave. It consists of 5 waves in the uptrend and 3 wave in the downtrend. And all other larger waves and smaller wave are based upon this pattern. Simply it denotes the rise of the market needs a longer time, but the fall is faster. Such as the wave of the sea or in a tsunami, people can observe it coming slowly, but when arrived, it can roll off everything in a short time. The slump of the market very often comes suddenly or anyway shorter than the rise.
Every wave is based upon the rising and falling standard wave, and the rising wave is known as impulse wave for it will advance and go higher and higher gradually and the waves of the sea are aiming at the shore. Waves will be moved upward or downward. Actually, the wave can be said to be made up of five and three in the style like the following:
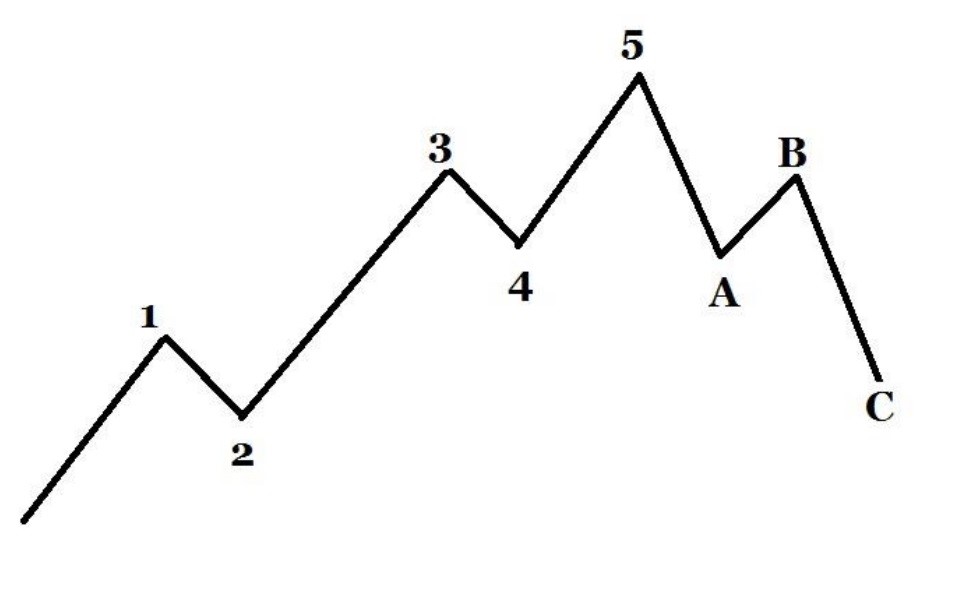
Figure (iii) A Primary Wave
The basic wave is quite easy to make readers recall the pattern of Head & Shoulders and it really can be exploited as like that. The difference is that Head & Shoulders is a single occurrence and not necessarily have repetition, but Wave Theory is a continuous trend or re-appearing the Basic Wave in different style. Sometimes it can have a Head & Shoulders inside and sometimes not, no specific relation to it, anything happening or non-happening are just co-incidence.
Mind that the numbers and letters are labelled at the end of the wave and not the starting point no matter in upward or downward wave. Therefore, there is no need to label the starting of wave 1, the number should place on top of the wave, and wave 2 since it is a downward wave, so labelled at bottom. Therefore the end of wave C actually is the starting point of wave 1. It is quite simple if the wave does not stop running, we are not sure when it will stop.
Sudden Test
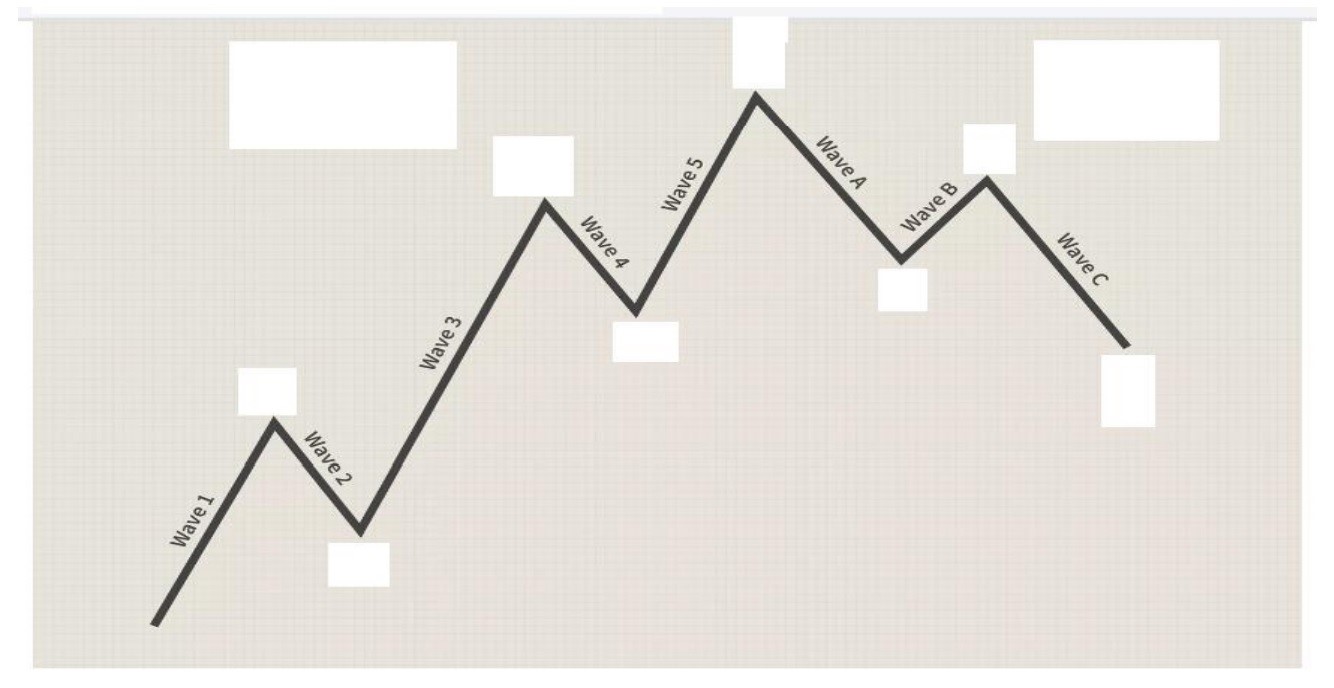
Figure (iv) Paths of waves
The paths of waves are shown in Figure (iv), but this kind of label along the wave line is seldom used, only for purpose of explanation. (Please fill in the blanks on your own, answer can be found in the end of this reading). However, waves 1, 3, 5 are known as impulsive waves for they are forwarding, and Wave 2, 4 are known as Corrective Waves for they are retreating. As for downward waves, wave A and C are known as impulsive waves and wave B is corrective. For further classifications, waves 1, 3, 5 are known as impulsive up waves, and waves A, C are impulsive downward waves. As for waves 2, 4 are corrective downward and wave B is corrective upward.
This is the greatest setback of Wave Theory, that is we cannot know the ending of a wave precisely, so we need the help of Fibonacci series and other technical indicators. Actually, no technical tools of Chart Analysis can be used alone, every tools is a subsidiary of others and inter-related to others. However, the greatest advantage is that they can apply to short, medium and long term upward, and can also enter into wavelet or minute wavelets of intraday charts. So every tool had their advantages and setbacks and we should fully utilize the advantages and avoid the setbacks.
The upward wave is called Impulsive wave which means it would further push up and the downward wave is known as corrective wave which denotes adjustment. And the whole trend can be further develop into a larger scale or go inside the smaller scale of intraday chart as in the following.
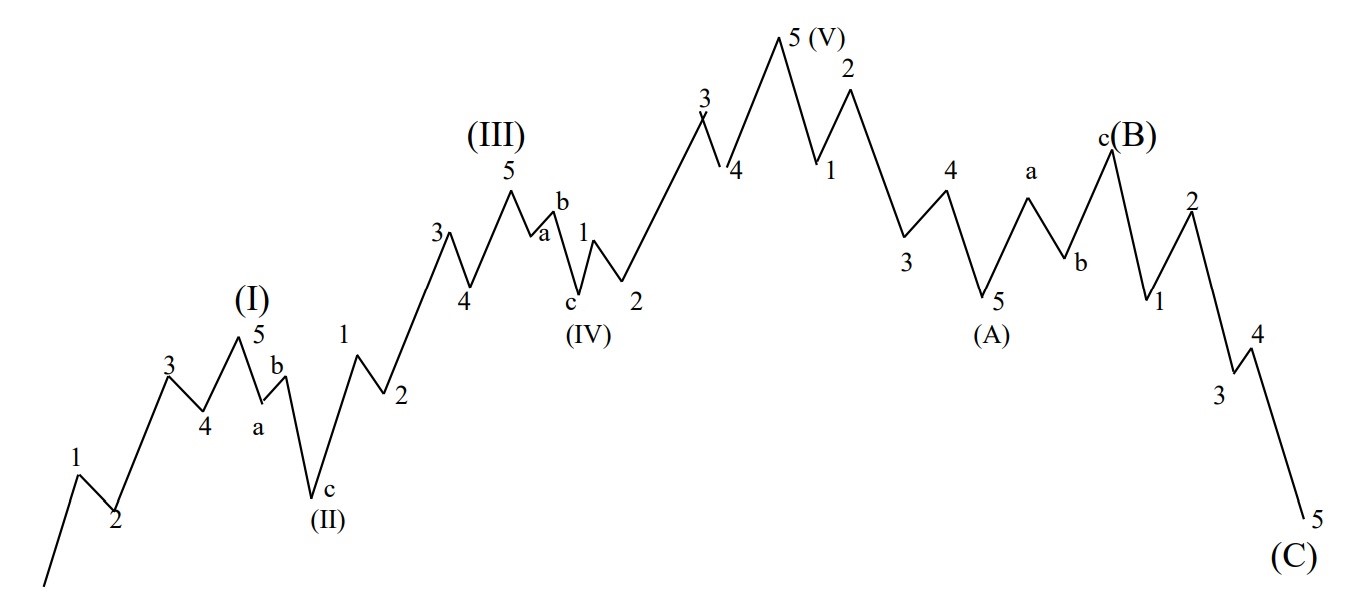
Figure (v) Development of Wave Theory
Mind that in the downtrend, wave 1, 2, 3, 4, 5 are still impulsive waves, but denoting going downward and not upward and corrective wave a, b, c are going upward even though the Basic wave of ABC are going downward. It can be easily understood when referring to chart of currencies. The rise of US Dollar actually is the fall of foreign currencies, and the fall the US Dollar is the rise of foreign currencies. Actually the above Figure (iii) can be understood as just one wave of the larger cycle, and that can further be develop in form of five to three series. Some people say that a complete wave consists of 144 waves, but actually when further developing is infinitive.
A complete cycle of waves altogether has 144 waves, it’s essential to understand how it forms, even though not so many times for readers to list out every single wave of the cycle. Everything is based upon Figure One the Primary wave of Basic Wave. It can be elaborated in the following 3 boxes.
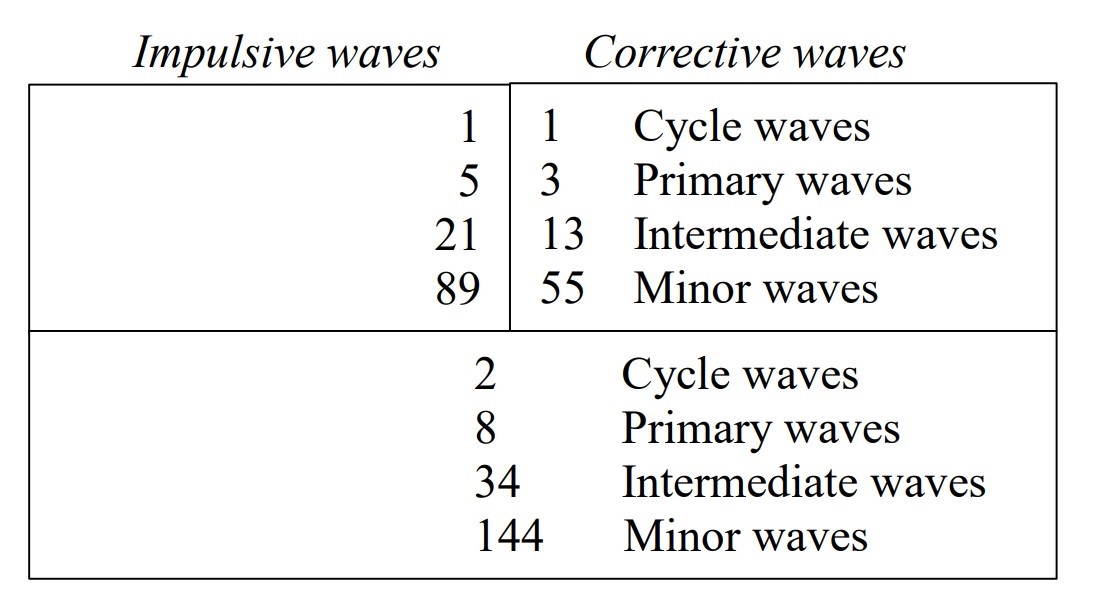
Figure (vi) Total number of waves
So let Figure (iii) reappears as following:
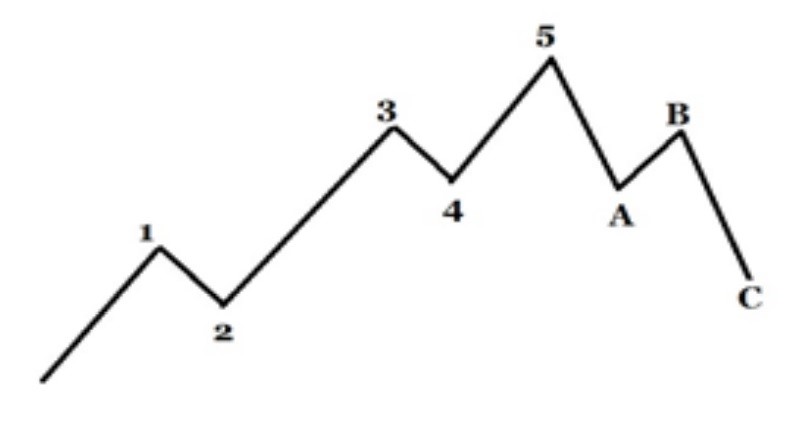
Figure (iii) A Primary Wave
How to merge this wave into the 3 boxes? The 5 upward waves are considering as an 1 impulsive of the upper left box, and the 3 downward waves is considered as 1 corrective wave of the upper right box. Therefore 1+1 = 2 and the 2 is shown as in the lower box.
So we come to the next row, the 5 means the whole wave of Figure one is repeated 5 times on the upper left box as upward waves, and 3 means downward waves on upper right box, and come to a sum of 8 as in the lower box.
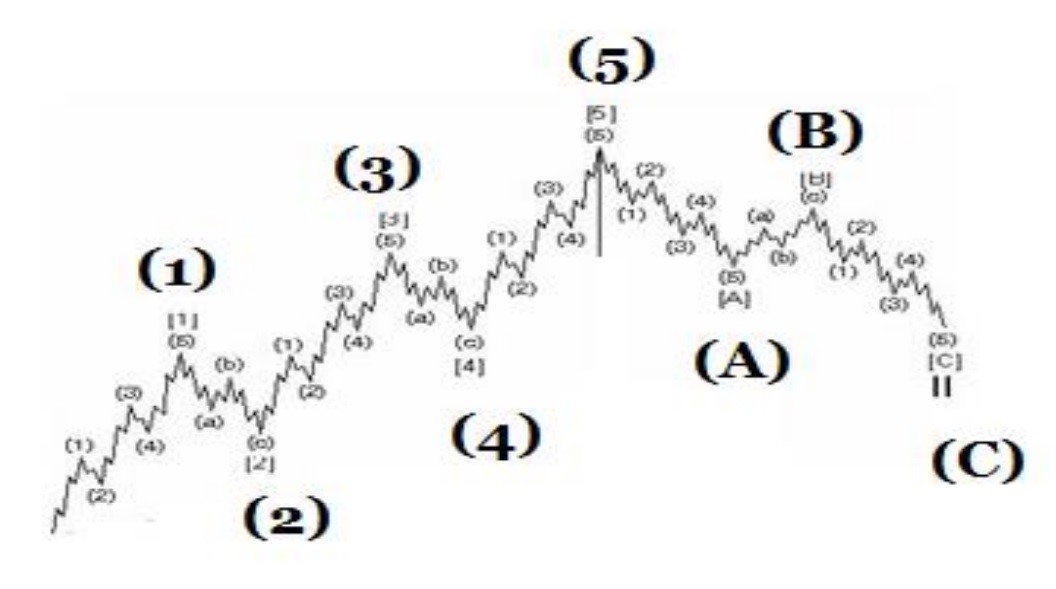
Figure (vii) 5 + 3 Waves Counting
So we come to the third row, the concept is the same as before, the upper left bow denotes 21 upward waves and upper right box denotes 13 downward waves come to the lower box of 34 as in Figure (iv)
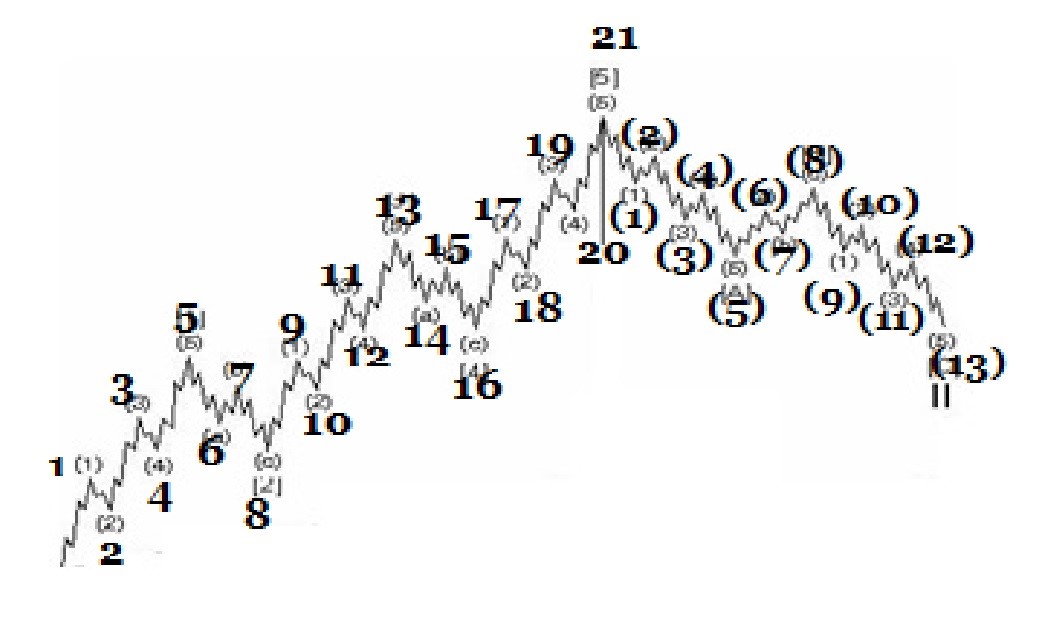
Figure (viii) 5 + 3 Waves Counting
So for the fourth row it’s the same, readers can enter into the blank chart in the Sudden Test to count the wavelets, the upper left box shows 89 upward waves and upper right box shows 55 downwards waves comes to a total of 144 in the lower box.
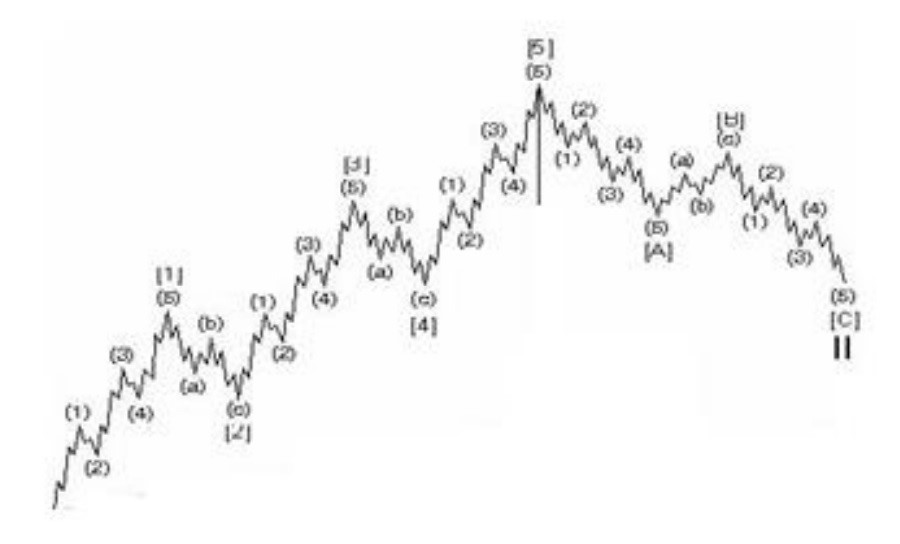
Figure (ix) 21 + 13 Waves Counting
Practically in daily usage, the need of counting the total 144 waves is quite rare, it is only for understanding the concept. In common usage, better refer to the various patterns of wave will be more practical. Above all, application is more important than memorizing the basic theory, for the variants are infinitive.
The above theory is based upon 5 and 3 of Impulsive Waves and Corrective Waves. The world is going forth but all extremes would bring about reverse. That is Impulsive waves are accompanied by Corrective Waves. However, each wave has not fixed length or high low points; it can be extended or contracted. The nine grades or cycles also have no definite class or when to upraise to another grade or class. But each wave has its own characteristics as followings:
So how it begins? How to find out the beginning of a wave? The concept of Tarot can be applied for the end of one cycle is also the beginning of another cycle, and keep on such a series. Also in form of music, the end of this Octave is also the beginning of another Octave, you can understand this easily from the piano keyboard.
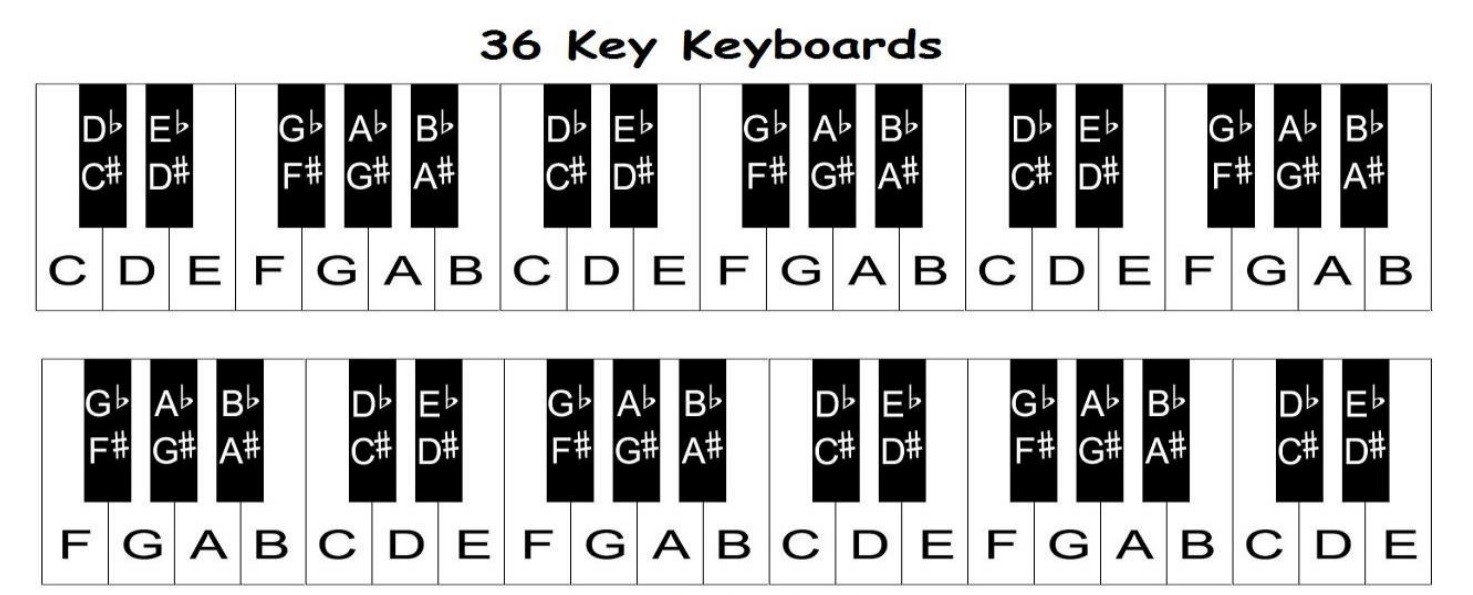
Figure (x) Piano keyboard
Wave Theory even is used widely, but the theory is just a guideline and has a lot of variant to dive the trend away, so sometimes the above terms may not necessarily come true and would have a lot of exceptions.
The hardest point of Wave Theory is to decide the length of a wave, even though it has no fixed discipline to follow, but guidelines can be seen in the Fibonacci series. As a rule, the theory is as easy as all that, but the application is the hardest. This series is based upon a series of numbers which are the essence of the universe from as large as the galaxy system and as tiny as the cells. Mind that the developer of Fibonacci series is not in an investor but a Mathematician. Therefore the most important part is still the application and not the elementary theory. The series is like this
1, 1, 2, 3, 5, 8, 13, 21, 34, 55, 89, 144, 233, 377, 610, 987,……
They are formed in a curved ratio as the following essence of the great nature.
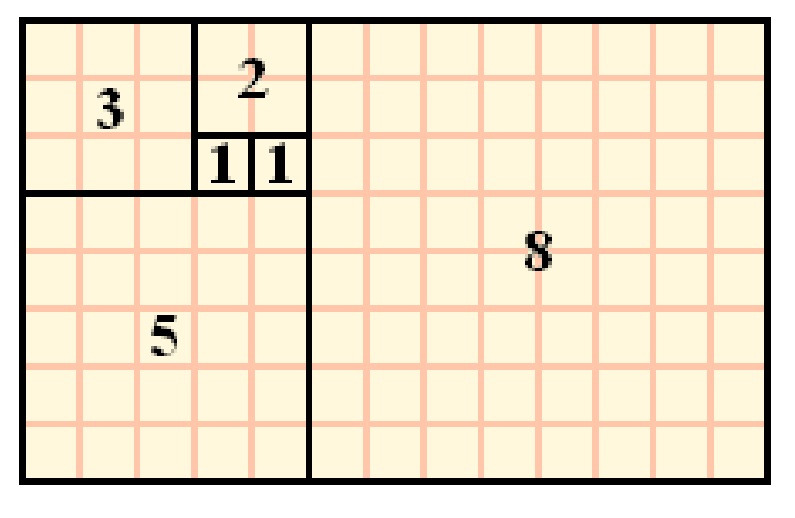
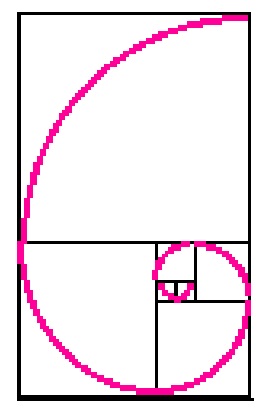
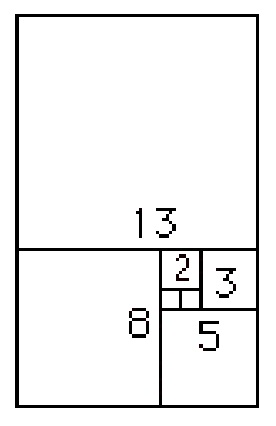
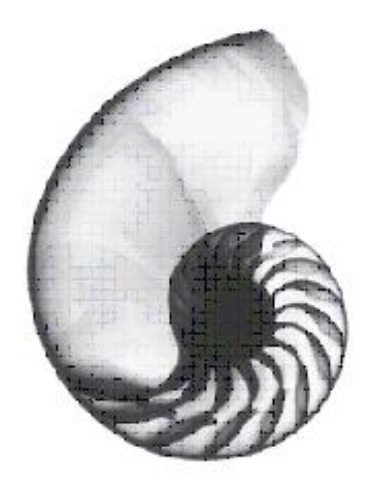
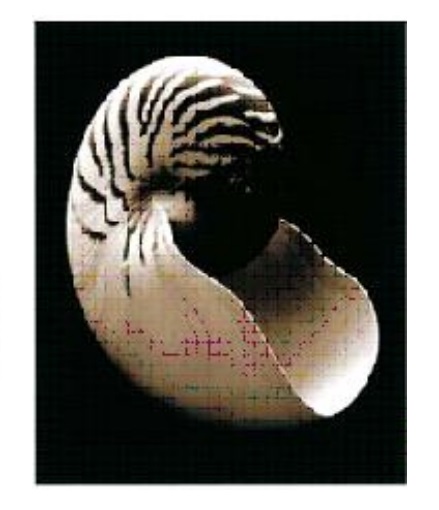


Figure (xi) various format of Fibonacci ratio in the nature
This means from the universe to sunflower and seashell curves are in such a ratio, but how it develops in other format? Besides curved format, we can also understand it from linear format. That is the family tree of rabbits.
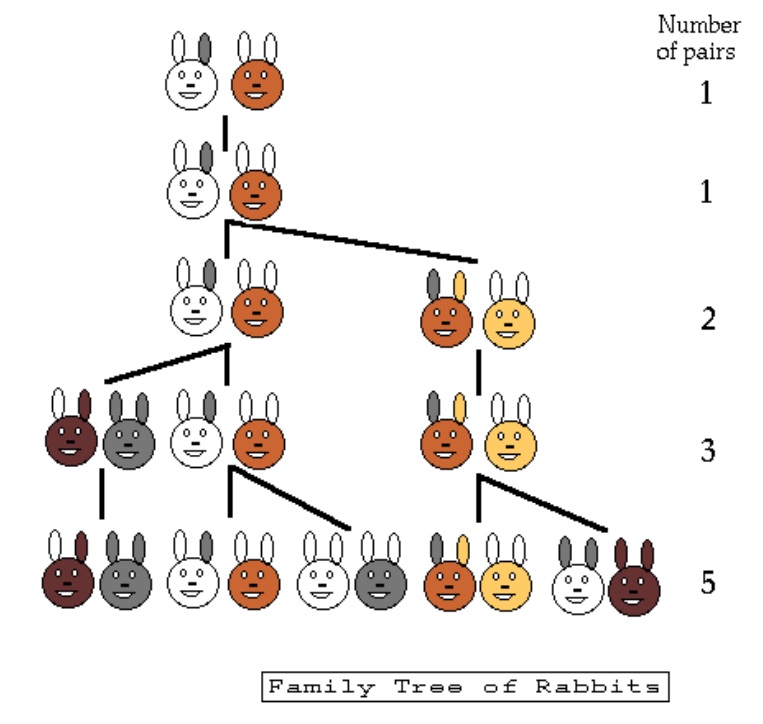
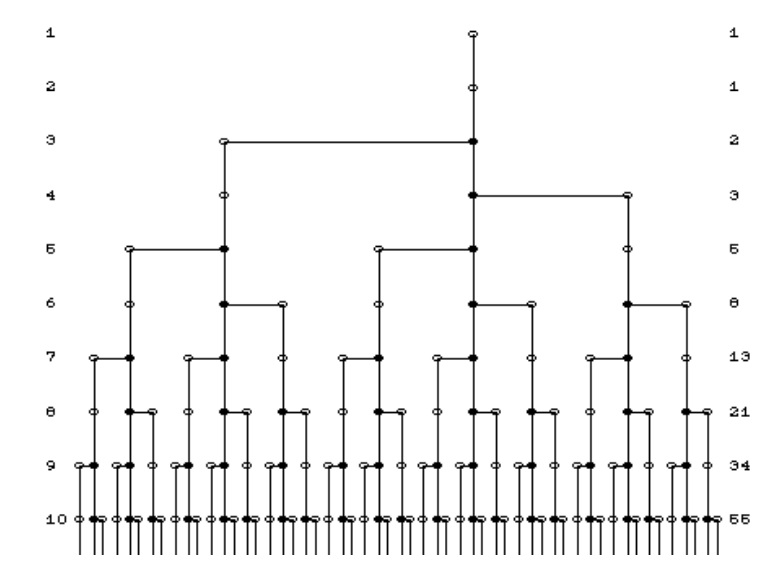
Figure (xii) Family Tree of Rabbit
1, 1, 2, 3, 5, 8, 13, 21, 34, 55, 89, 144, 233, 377, 610, 981, 1597, 2584, 4181, 6765, 10946 …..
The Rabbit Family Tree is a hypothetical implication assuming in a closed society that a male and female rabbit mate together and produce another pair of male and female rabbit in such a series. When carrying on, there will be a lot of evidence on plants, petals, flowers, fruits and beehive…. Etc. Readers can have a deeper research on their own. Thus we can carry on the related ratios.
The Fibonacci ratio is based upon a series of numbers, and we apply this into the chart analysis. However, sometimes it seems to be quite accurate and sometimes not. Why? We have to understand from the root first.
The ratio is that for this series of numbers, when adding the first two numbers equals to the third, that is 2+3 = 5, and 3+5 = 8 and so one. But when applying to chart analysis, we use another form of ratio. It seemed to be quite accurate, but if you go deeply inside, you will find something special. Normally, the ratio of Wave Theory is derived from these ratios.
1) 0.618 and 1.618
When the previous number is divided by the following figure, it will come to a ratio of 0.618 and when divided by the previous figures the ratio is 1.618. Mind that initially the ratio is not exactly as stated, but when carry forth to the eight or ninth item, henceforward it become more accurate. When such a ratio exists, it also can be understand as for longer term purpose it will be more accurate. So when applying this to shorter term purpose, should know about this.
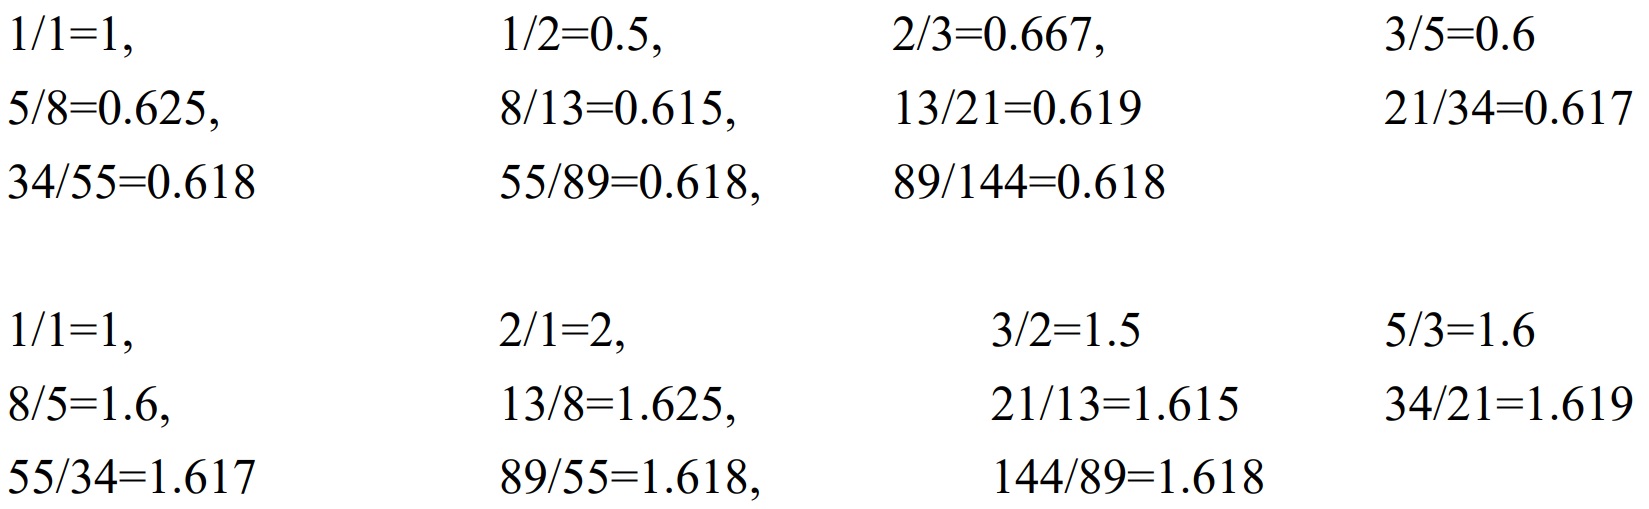
Figure (xiii) Ratio forwarding
2) 382 and 2.618
When the number is divided by the following 2 numbers, it can come to a ratio of 0.382 and vice versa will be 2.618.
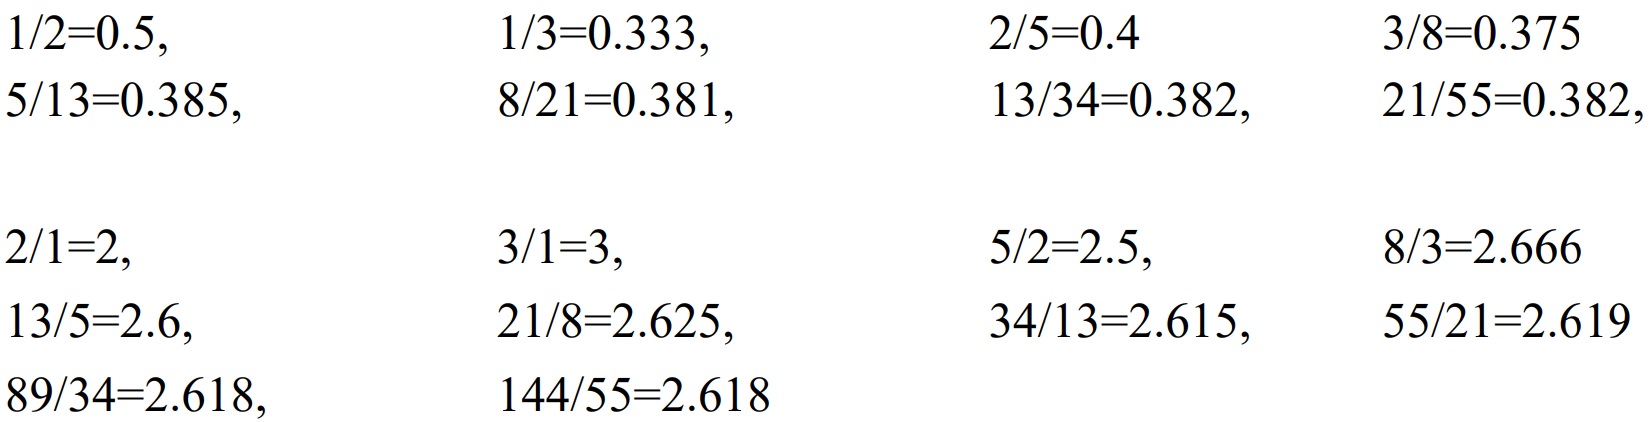
Figure (xiv) Ratio backwarding
The inter-related ratio is as following.
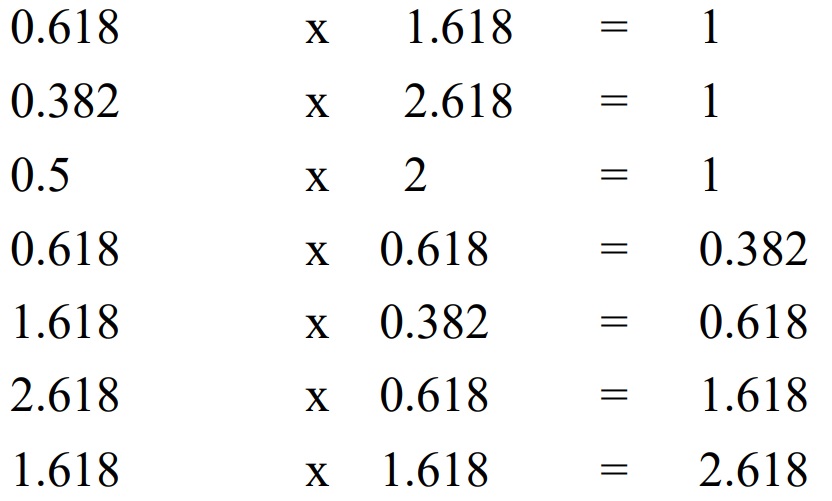
Figure (xiv) Ratio backwarding
So applying into chart analysis, the ratio will be as following.
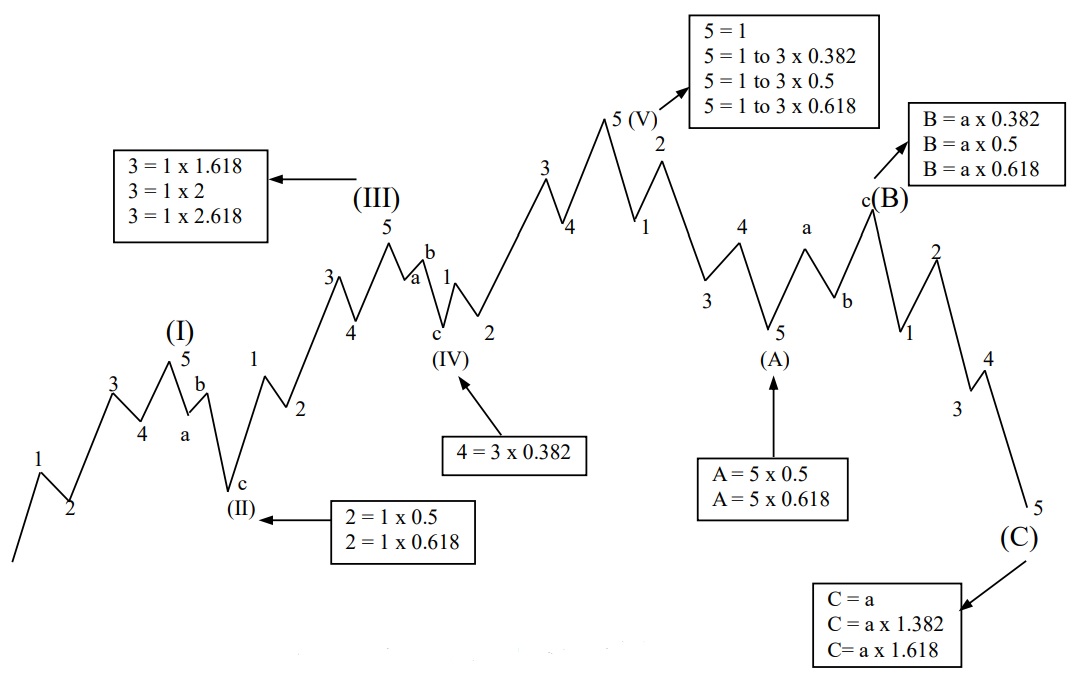
Figure (xv) Various Ratio of Waves
That is we have to fix wave I first, and if wave I goes up for 100 points, the adjustment will be either 0.5 or 0.618, that is 50 points or 61.8 points. Wave III very often is the longest, so that ratio will be either 0.618 or 2 or 2.168 which means 61.8 points or 200 points or 261.8 points. Mind that the adjustment in Wave II is deeper, and in Wave IV is slighter, for in Wave II people are afraid the Bear Market is still carrying on, so they dare not to buy too early, but in Wave IV, after the rush of Wave III, they hurry up to buy and afraid they could not buy at such a cheap price, so the adjustment is slighter.
Mind that in Wave V, the calculation is from the bottom of Wave I to top of Wave III, do not add on the total length of Wave I and III. This is also called combined measurement. When adding the total length of Wave I and Wave III, you have to subtract the Wave II also because it is a corrective Wave. Therefore just measure the total height is enough. The measurement of Wave V is very important as it tell the end of Bull market. But very often have to use with other indicators.
Wave Theory has to merge with practical situation and economic cycle. Further discussion will be in Advanced Level Course.
1) Extensions
In a long Bull Market, it is not easy to count the waves. As the longest Bull Market in US lasted for over 10 years, so when counting the waves, it is not easy to figure out the last wave which is Wave 5. In practical case, when people think that wave completed and it still goes on. We call this an extension. This not only happens in Wave 5, but can also happen in Wave 1 and 3. On counting of waves, investor at length found that it is not really the fifth wave, but just an extension of Wave 3.
The fact is that when referring to Figure (xiii) Ratio forwarding and Figure (xiv) Ratio backwarding together with the application in Figure (xv) Various Ratio of Waves, there are several choices to fix the length of a ratio. It depends on experience to a certain extent. A single wave can be extended for several times. For beginners, it is not easy to grasp the spirit, it can also be known as a setback of Wave Theory.

Figure (xvi) Left is Explosive Wave 3 and right is impulsive Wave 3 of the same points high. Both are considered as standard wave 3.
2) Truncation
Truncation here means to cut short suddenly, and is always use to describe Wave 5. It goes after the explosive and impulsive wave. Wave 3 is not only often is the longest, but also most explosive. That means Wave 3 can just shoot up in a big white candlestick for several hundred points per day and finish in one or two days, longest does not mean in time but can be in span. For example it can use 3 months to run the span of 300 points, but also can use 3 days to run 300 points, the latter is known as explosive and former is impulsive. Longest is not necessarily in time but can be in span or points.
No matter it is explosive or impulsive; it is easy to be exhausted. That is the extension is too much, and cannot extend higher but can further. That is Wave 5 sometimes cannot go over the height of Wave 3, and formed a flat top, it is known as a Failure Wave or Truncation. In chart pattern will be known as Double Top, and while standard Wave 5 will be known as Head & Shoulders together with Wave 3 and Wave B.
Please consult the following two figures together
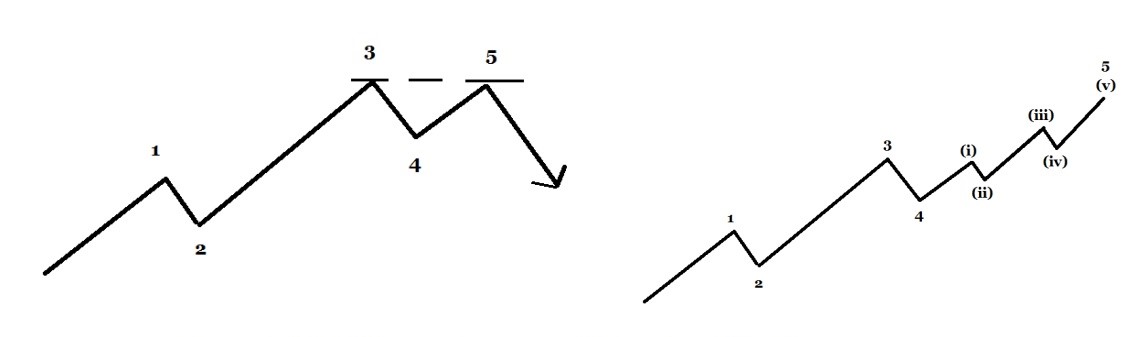
Figure (xvii) Left showing Truncation of Wave 5 which is a flat top, but right showing that it can have extension to a higher wave.
In deciding whether it is a Truncation, it needs experience and choosing the right technical indicators to help with the decision.
3) Trumpet shape & Funnel shape
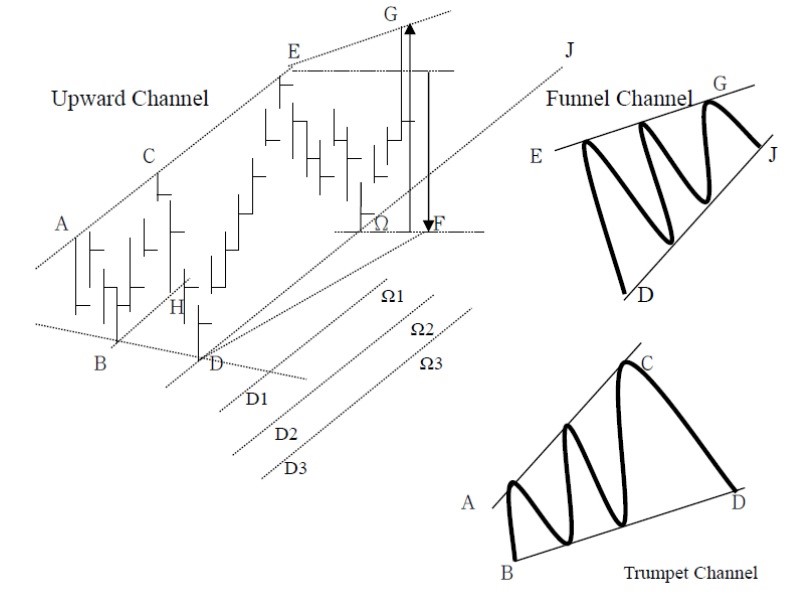
Figure (xviii) Funnel shape and Trumpet shape
Please refer to Allocution 4 Chart Pattern (B), when Funnel shape appears in Wave 5, it is quite near the end of that cycle, no matter in uptrend or downtrend. Trumpet shape denotes the fluctuation is larger and normally at top of a wave, Funnel shape denotes the velocity is weaker and can appear in either of the 5 waves.
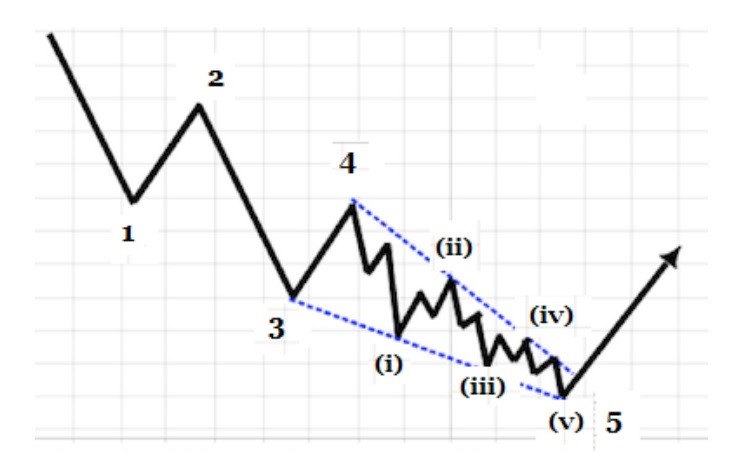
Figure (xix) Funnel shape denotes the end of a downward wave for the velocity is weaker
and unable to fall further.
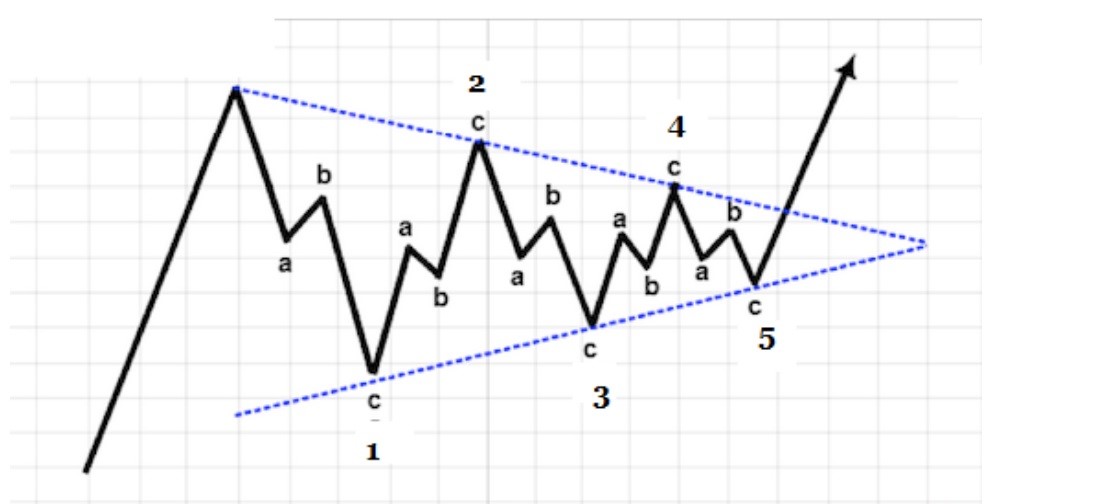
Figure (xx) Funnel shape can develop further into various type of triangle, including ascending, descending or symmetric triangle.
4) Conclusion
As a rule, basic theory is quite easy to learn, but application is the hardest, so for application of Wave Theory will be explain in Video 7.
Average Lines is a type of tools which is most commonly used, but unluckily always underestimated for some people would think it is too easy, and believe that hard and complicated formulas would be more accurate. Actually, the focus lies in application and not the formulas. But before we go to the application, we have to know about the basic theories first. Even though there are so many kinds of averages line in the internet, but the mostly commonly used are Simple Moving Average (SMA), Weighted Moving Average (WMA) and Exponential Average (EMA). The essence lies on two romantic terms which are Golden Cross and Death Cross. Readers can also invent more romantic and attractive terms, anyway they are denoting the change of a trend according to the average calculation of the past and use it to predict the future.
It is also the easiest theory to understand. In the market measurement method of nowadays, although there are various methods with different levels of difficulty, the average line is still an indispensable link.
The average line is the sum of the closing prices of a certain period and then divided by the days of the period, and then connected to compare with the daily price. It is used to predict the trend of future market conditions. Make it simple, when the price is above the average line, it indicates that the market outlook is good, and when below the average line, it indicates that the outlook is weak.
No matter there are 8 kinds or 10 kinds of moving averages, when we understand the essence, we can use the mouse to click on and find out the forecast we need easily. Moving Averages only records the past and calculate on the past, they won’t tell you the future, it is the analyst that tells out the future.
As for complicated formulas, we can talk about it in advanced course, so we directly go to application first.
1) Basic Buying and Selling signals
The purpose of plotting the moving average line is to compare the relationship between the current price level and past level within a certain period. When the price level crosses the average line, it becomes a signal to buy or sell goods. But it must be fixed by the closing price. That is if the intraday price having a breakthrough but the closing price retreats back to pre- penetrated level, it is known as false penetration. When closing price passed through it is a genuine penetration. However, it is still not enough, the following day the closing price must be above the penetration day to confirm, and better the whole stick is above it than it is a firm pattern, if it goes up and down and only the closing price is above, it is still a confirmation but not quite firm.
This is the basic Buying or Selling signal and confirmation.
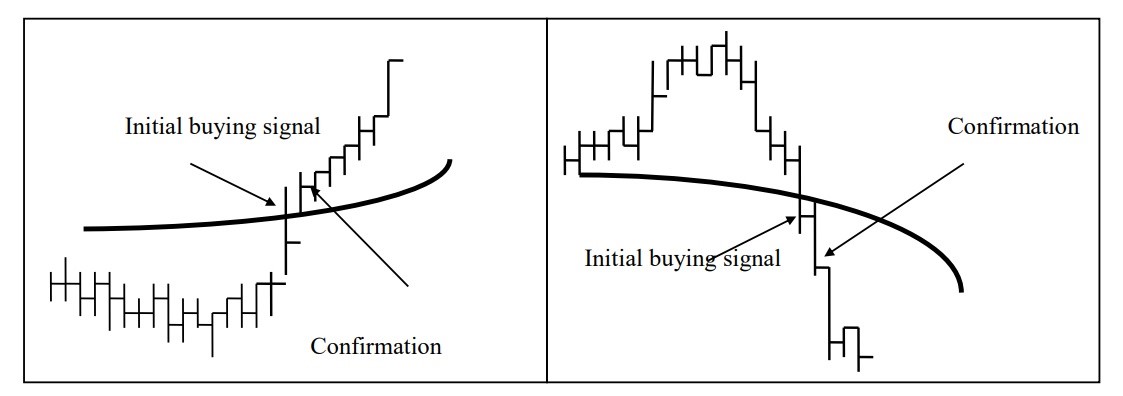
Figure (xxi) Buying, Selling Signals & Confirmation
2) Basic Buying and Selling signals
Besides showing buying and selling signals, moving average can also be used to forecast the change of a trend and erect a support or resistance level for reference. In a main and continuous trend, normally the moving average is slower than the market. That is if the market continues to rise for 10 days, the 10-day average line should be lower than the current price, for it is an average of the previous 10 days of rising from low to high. This invisible effort is known as support. If there is a fall or adjustment, the averages line will be treated as a stop point, but still needed to be used with other indicators. It does not mean surely will turn back at this level, but at least it is a midway stop point for short term purpose so as to have further observation. When the market breaks through the average line and continues to fall, that is when the price and the average line intersect, it also represents the time when the market is turning down. After the price drops, the initial several days the moving average will still continue to rise. At this time, it means that the decline has not been sharp yet and there is still hope of recovery. Later, if the average line itself still turns from upwards to downwards, this means that the bear market has already formed and it will take some time for the market to resume its upward trend. It can also be said that the bear market has entered the second phase.
That means the average line can show two trends, when price drop from above to cross the moving average, it is the first stage of falling, but later on when average line also turned from rising to falling it is the second stage and vice versa.
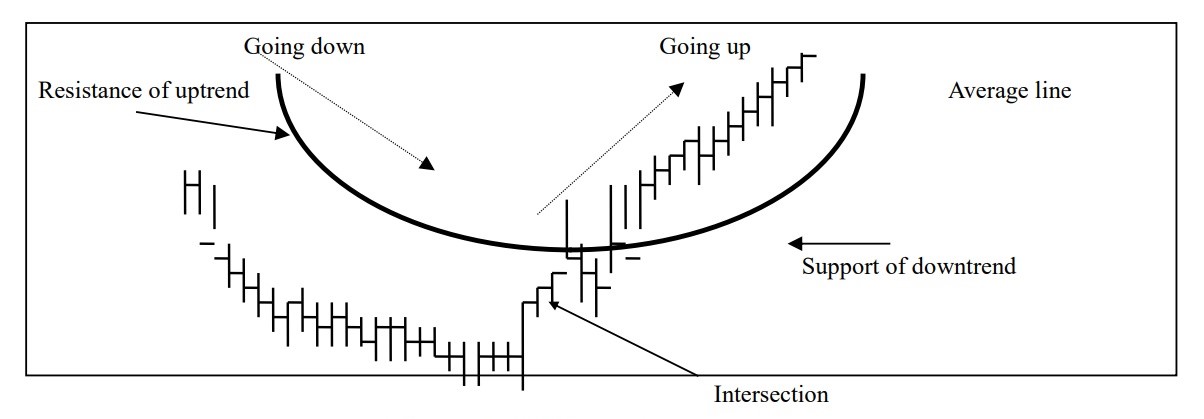
Figure (xxii) Intersection
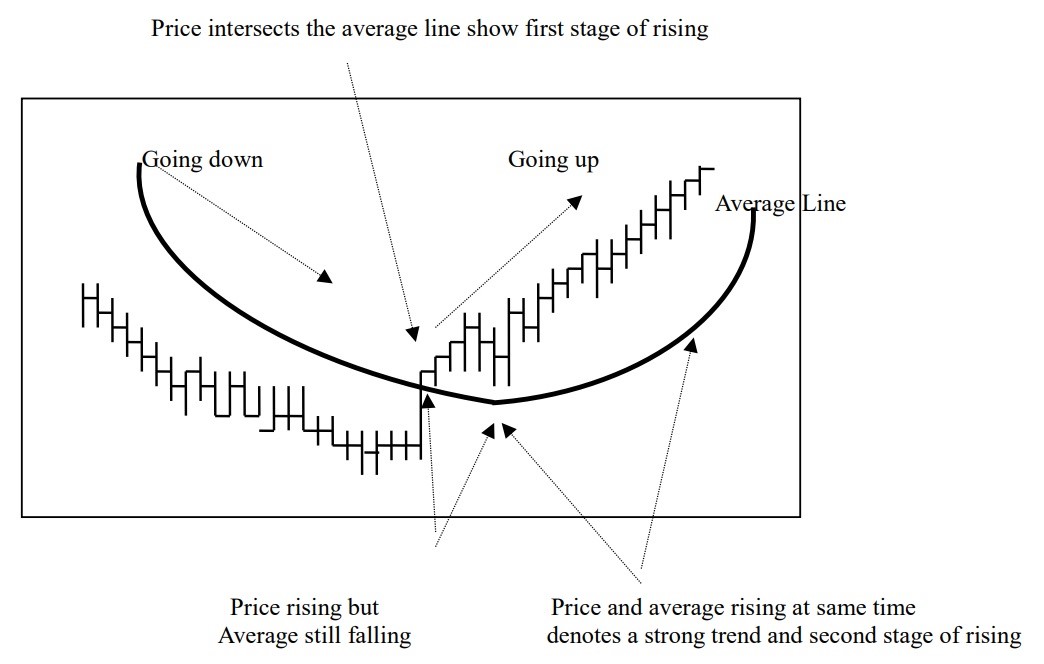
Figure (xxiii) Change of Trend
3) Intersection
In practical application moving averages are use in a group of lines such as 10 days for short term, 20 days for medium term, 50 days and 100 days for medium to long term and 150 and 200 days for long term purpose. In American stock markets, they use the 200 day line as the longest known as the yearly line, while in Asia, they would use 250 day line as the yearly line and watershed for Bull Market and Bear Market. When a line cross from the low to high we call it a golden intersection or golden cross, which denotes an uptrend, and when crossing from upside to down side we call it death intersection or death cross. Practical application is as following:
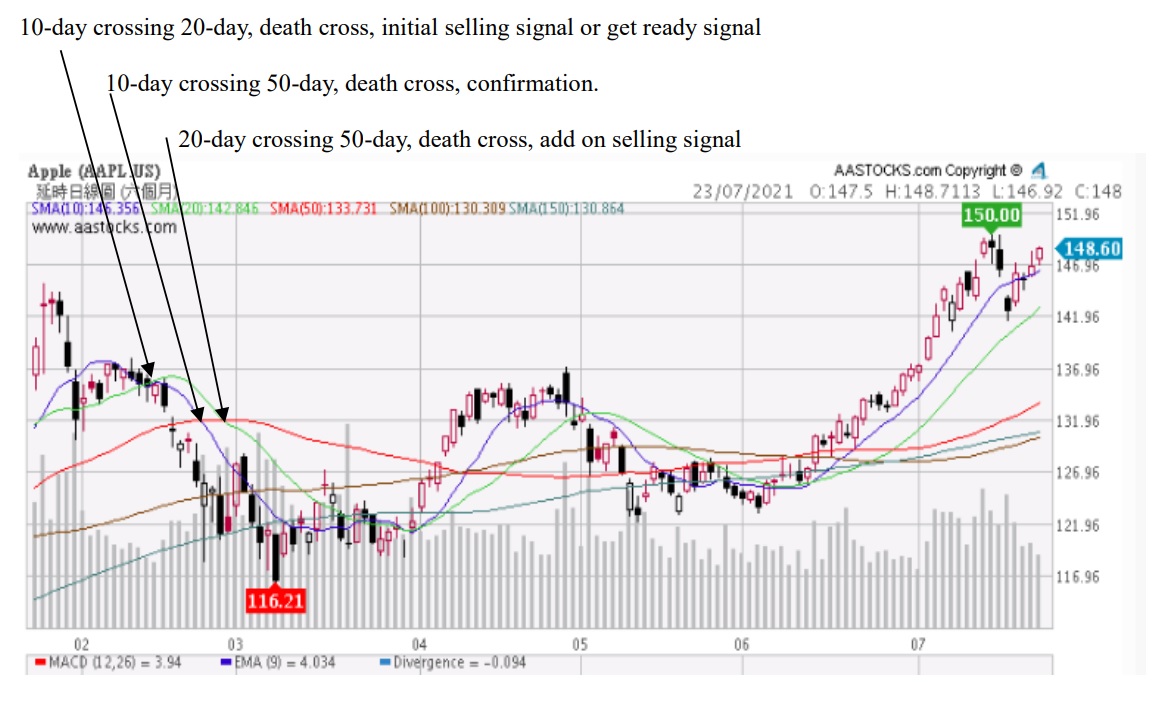
Figure (xxiv) Death Intersection
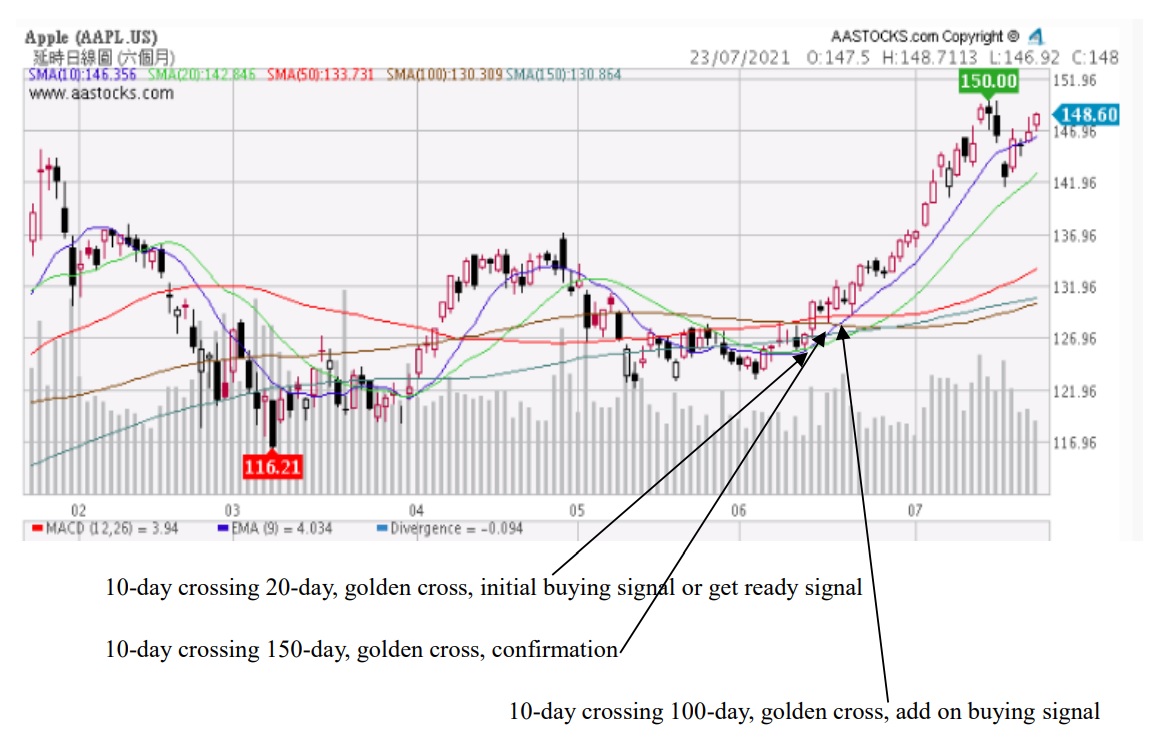
Figure (xxiv) Death Intersection
4) Conclusion
There is no fixed rules of how many moving averages should group together to use, normally 5 to 6 lines. And intervals also have several kinds, such as 10, 20, 50, 100, 150, 200 or 15, 30, 75, 125, 250 or other different kinds using interchangeably. Most commonly used lines are Simple Moving Average (SMA), Weighted Moving Average (WMA) and Exponential Average (EMA). No need to mind about how the formula is calculated, the computer will calculate everything for you. It is no use to memorize those complicated formulas, rather likely, focus is on application.
Answer to Sudden Test
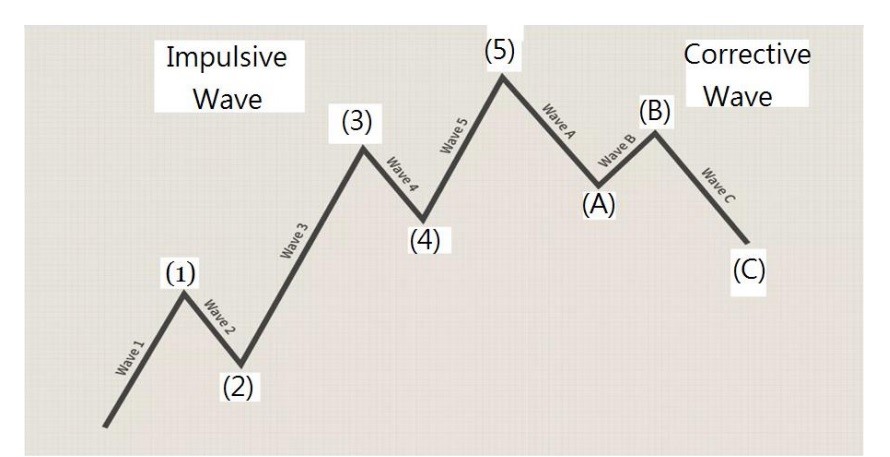
Figure (xxvi) Answer